
Nvidia GPU Metrics/Alerting
In the last post, I covered how to enable the Nvidia GPU in RHOAI (Openshift AI). Today, we will cover metrics that can be exposed through the the Openshift Web Console. This Prometheus Telemetry/metrics data can then be used to develop custom queries to send alerts through AlertManager.
Enabling GPU Monitoring and Metrics in Openshift
The steps I that are being followed are based on the following documentation:
The following commands will be run from the OC CLI.
# Download the JSON for CM
curl -LfO https://github.com/NVIDIA/dcgm-exporter/raw/main/grafana/dcgm-exporter-dashboard.json
# Create the CM
oc create configmap nvidia-dcgm-exporter-dashboard -n openshift-config-managed --from-file=dcgm-exporter-dashboard.json
#For view in Administrator perspective
oc label configmap nvidia-dcgm-exporter-dashboard -n openshift-config-managed "console.openshift.io/dashboard=true"
# For view in developer perspective
oc label configmap nvidia-dcgm-exporter-dashboard -n openshift-config-managed "console.openshift.io/odc-dashboard=true"
# Verify labels
oc -n openshift-config-managed get cm nvidia-dcgm-exporter-dashboard --show-labels
The output to the last command will look as follows:

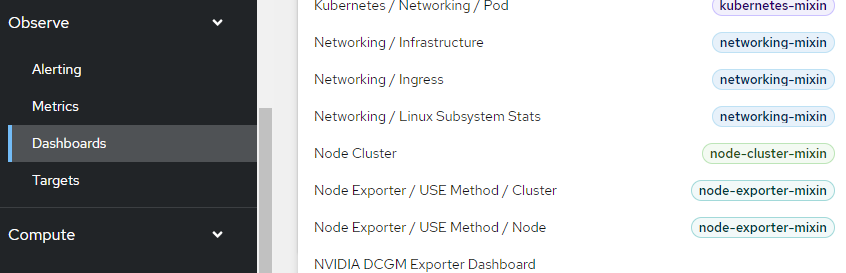
Now, verify that the Openshift Web Console shows this information in the Administrator perspective. Go to Observe --> Dashboards --> Nvidia DCGM Exporter Dashboard
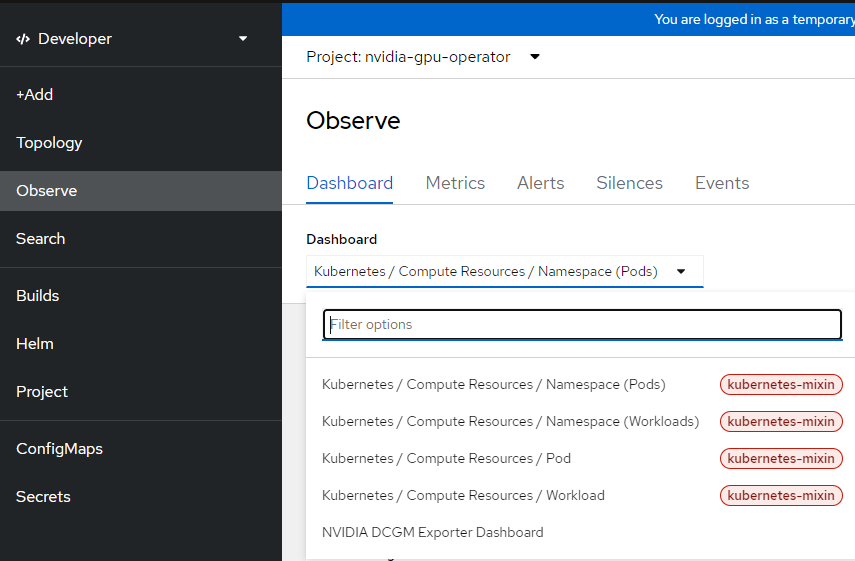
For the Developer perspective, go to Observe --> nvidia-gpu-operator namespace –> Dashboard --> Nvidia DCGM Exporter Dashboard
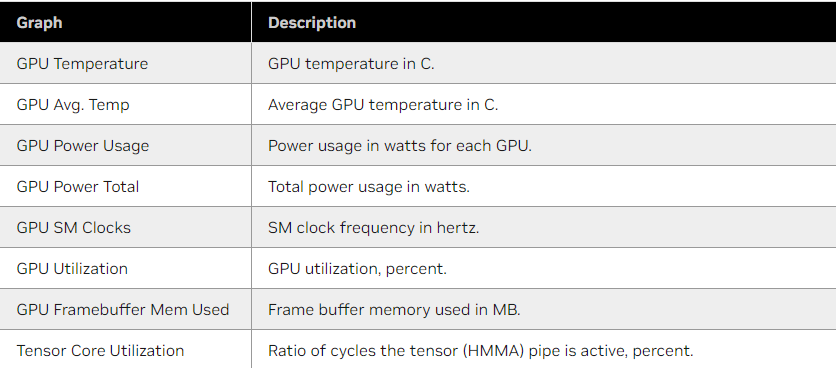
Here are the default metrics that will show up in this dashboard
Now, let's put together some AlertManager rules for each of these metrics.
I've created a GitHub repo with all of the sample YAML files:
 kcalliga
Some Fact-Finding
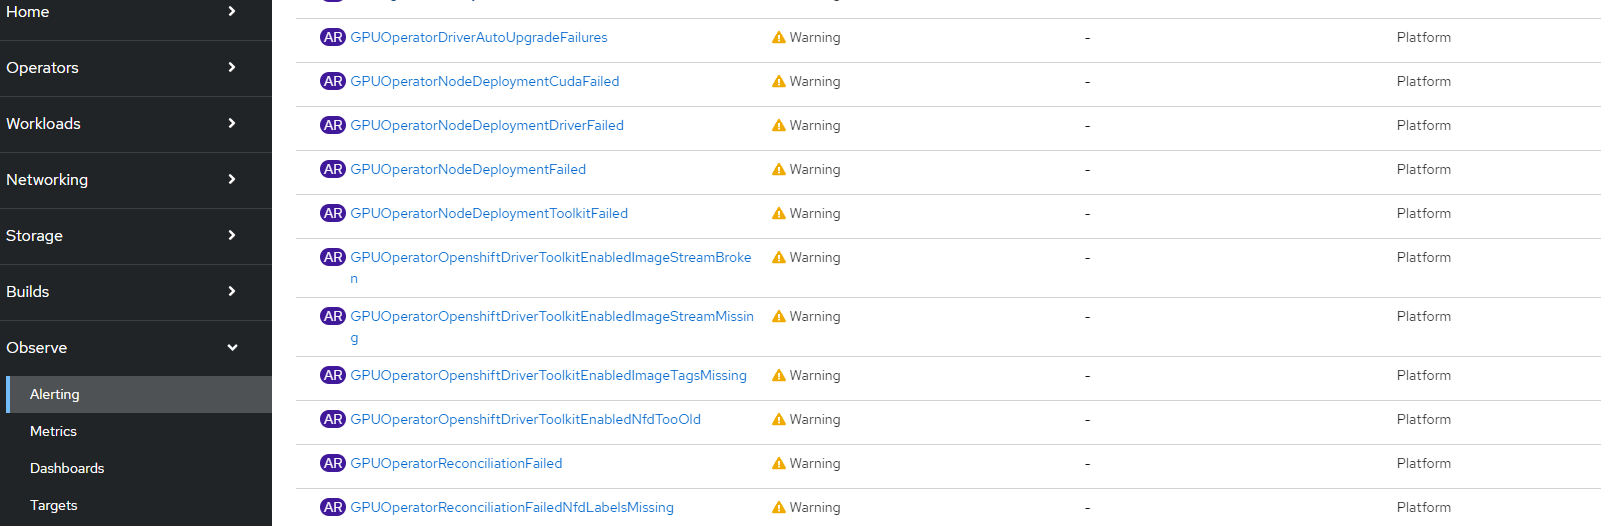
There are a few alerts that come with the GPU operator. These are shown below:
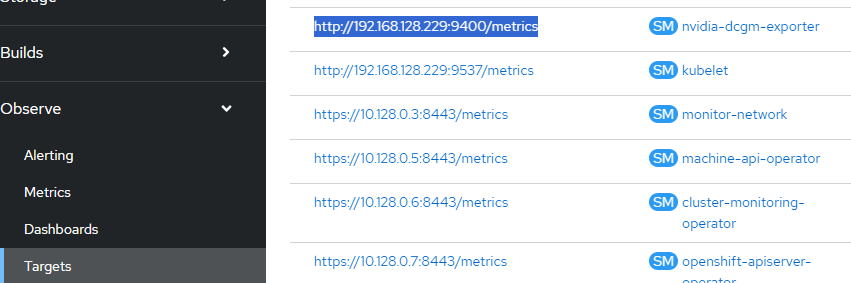
- Go to Observe --> Targets and search for the nvidia-dcgm-exporter ServiceMonitor CRD. It will be exposed through a NodePort on one of your OCP nodes. In this case, my endpoint is http://192.168.128.229:9400/metrics
Here is some information that shows up there:
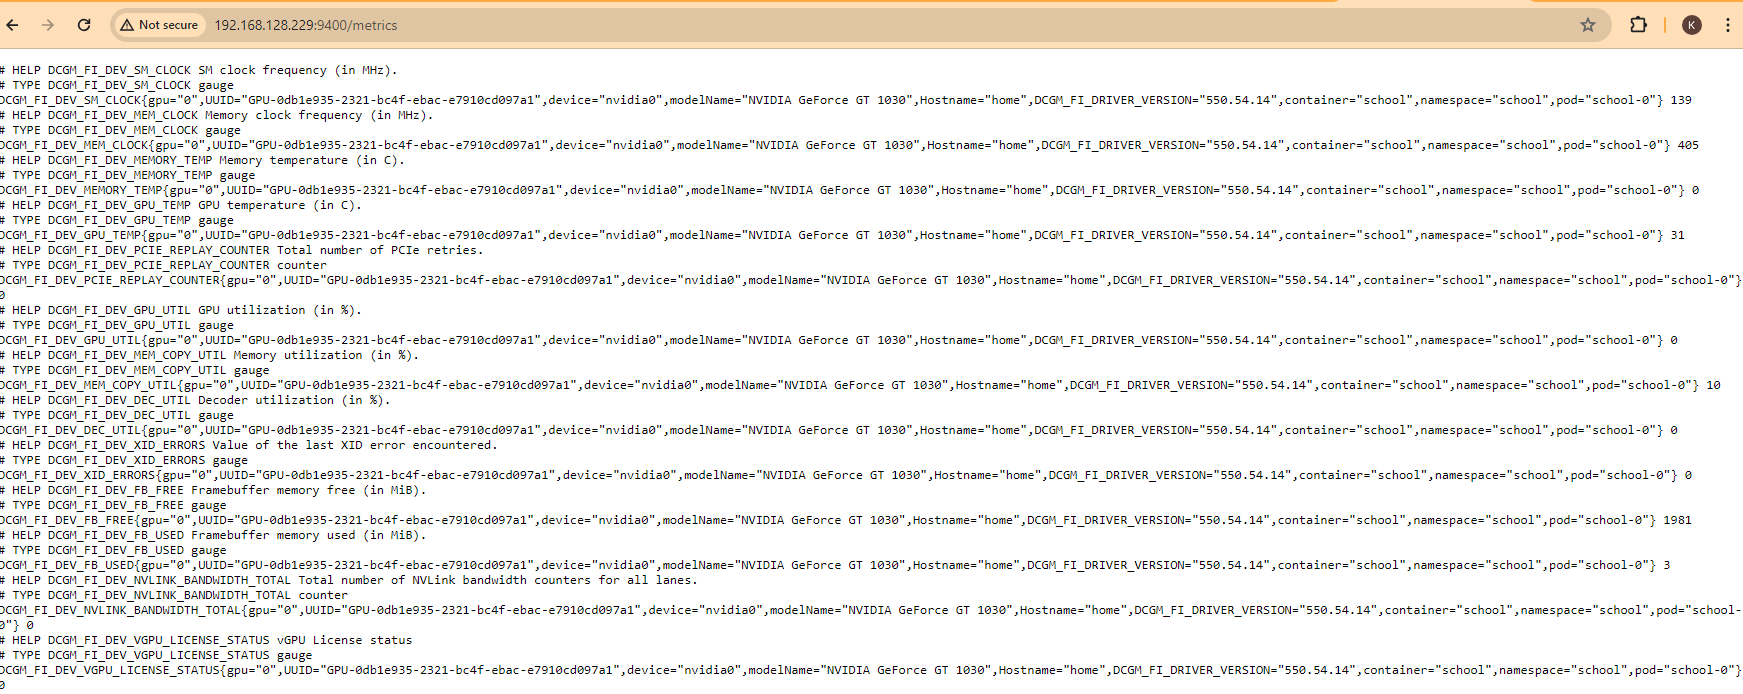
Let me break this down into a table so it easier to read the description for each of these. We will use this information to develop the alerts.
DCGM_FI_DEV_SM_CLOCK SM clock frequency (in MHz).
DCGM_FI_DEV_MEM_CLOCK Memory clock frequency (in MHz).
DCGM_FI_DEV_MEMORY_TEMP Memory temperature (in C).
DCGM_FI_DEV_GPU_TEMP GPU temperature (in C).
DCGM_FI_DEV_PCIE_REPLAY_COUNTER Total number of PCIe retries.
DCGM_FI_DEV_GPU_UTIL GPU utilization (in %).
DCGM_FI_DEV_MEM_COPY_UTIL Memory utilization (in %).
DCGM_FI_DEV_DEC_UTIL Decoder utilization (in %).
DCGM_FI_DEV_XID_ERRORS Value of the last XID error encountered.
DCGM_FI_DEV_FB_FREE Framebuffer memory free (in MiB).
DCGM_FI_DEV_FB_USED Framebuffer memory used (in MiB).
DCGM_FI_DEV_NVLINK_BANDWIDTH_TOTAL Total number of NVLink bandwidth counters for all lanes.
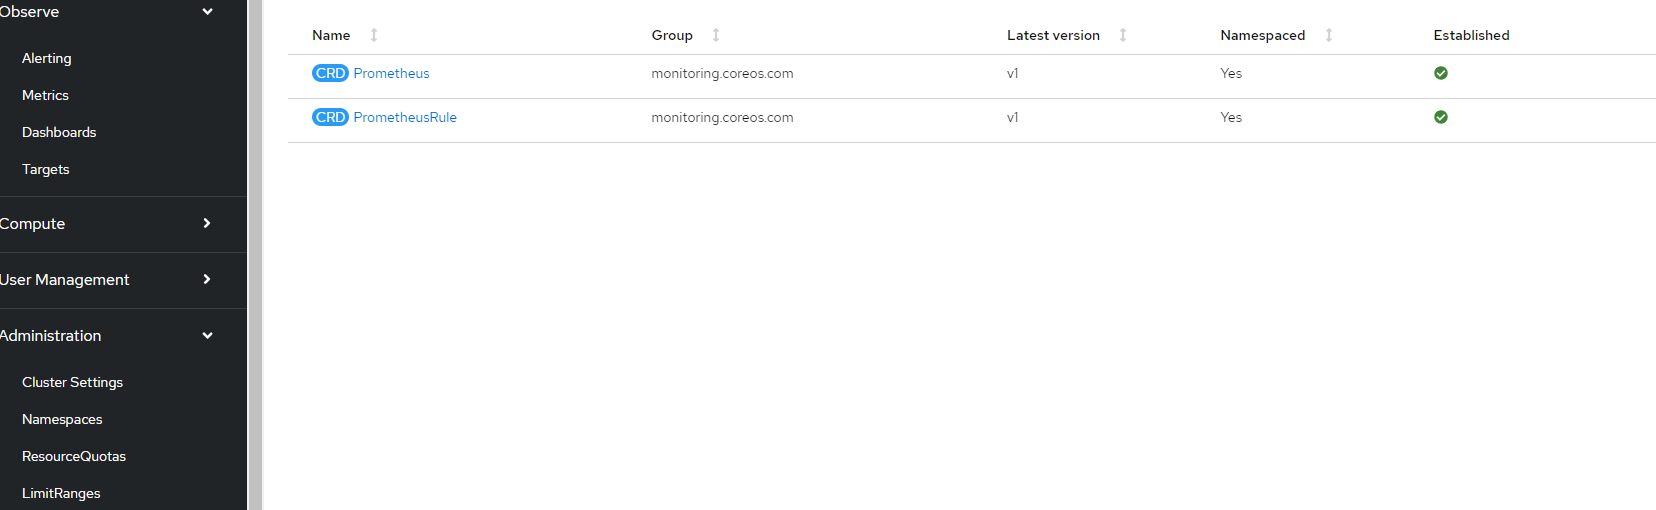
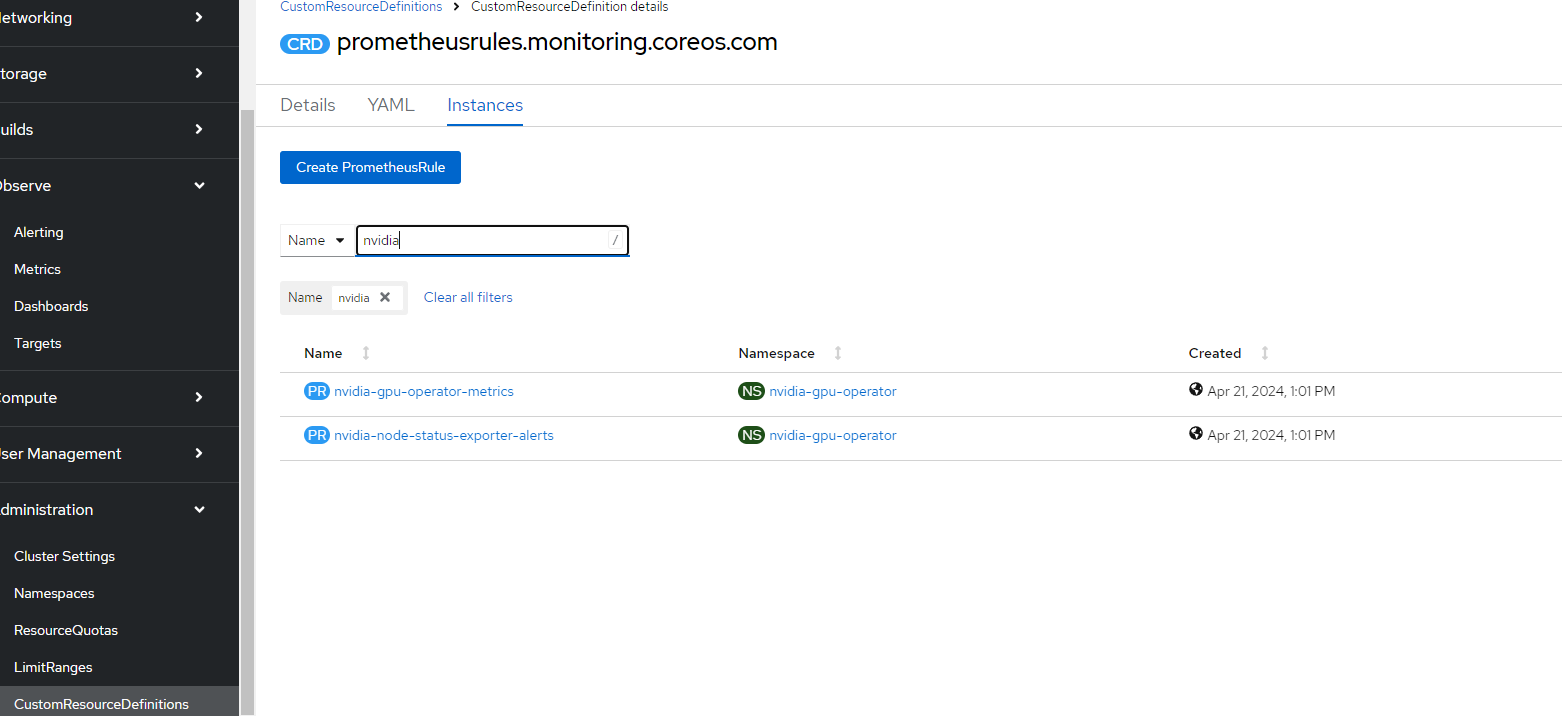
DCGM_FI_DEV_VGPU_LICENSE_STATUS vGPU License status- To see the raw PrometheusRule CRDs, look at Administration --> Custom Resource Definitions --> PrometheusRule
- Go to Instances and search for nvidia. You will see two PrometheusRule CRDs
Creating PrometheusRule for GPU Temperature
The metric that will be used for this AlertManager rule will be GPU temperature (DCGM_FI_DEV_GPU_TEMP)
To see this information on the Openshift Web Console, go to Observe --> Metrics and run a query on DCGM_FI_DEV_GPU_TEMP as shown below (current value is 31 degrees Celsius):
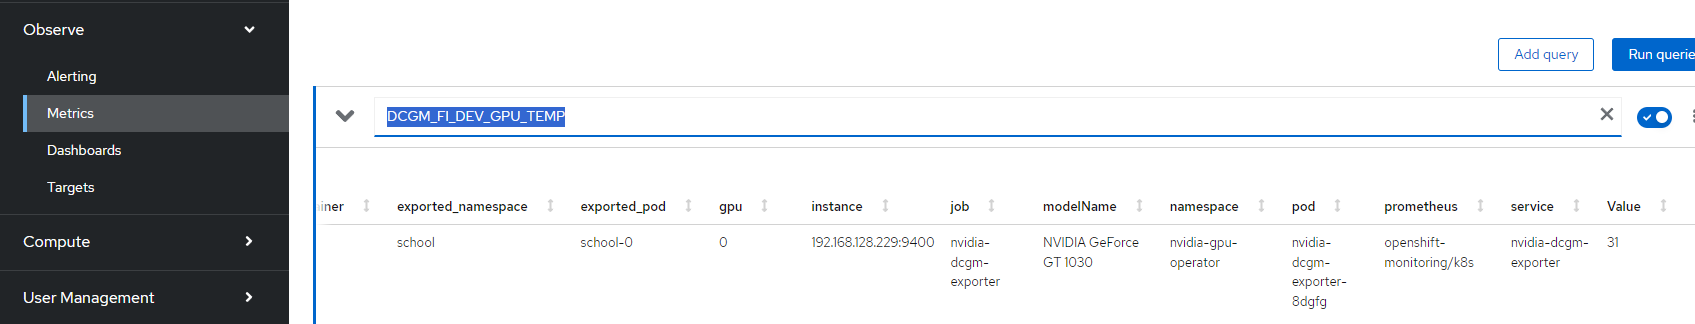
For demonstration purposes, I will setup an alert that goes off when the temperature of the GPU is over 30 degrees Celsius. This will go off because my current temperature is 31.
apiVersion: monitoring.coreos.com/v1
kind: PrometheusRule
metadata:
  name: gputemp
  namespace: nvidia-gpu-operator
spec:
  groups:
  - name: gputemp-rule
    rules:
    - alert: gputemp
      expr:
        DCGM_FI_DEV_GPU_TEMP  > 30
      labels:
        severity: critical
      annotations:
        description: GPU Temperature is over 30 degree Celsius
This code is also at my Git repo
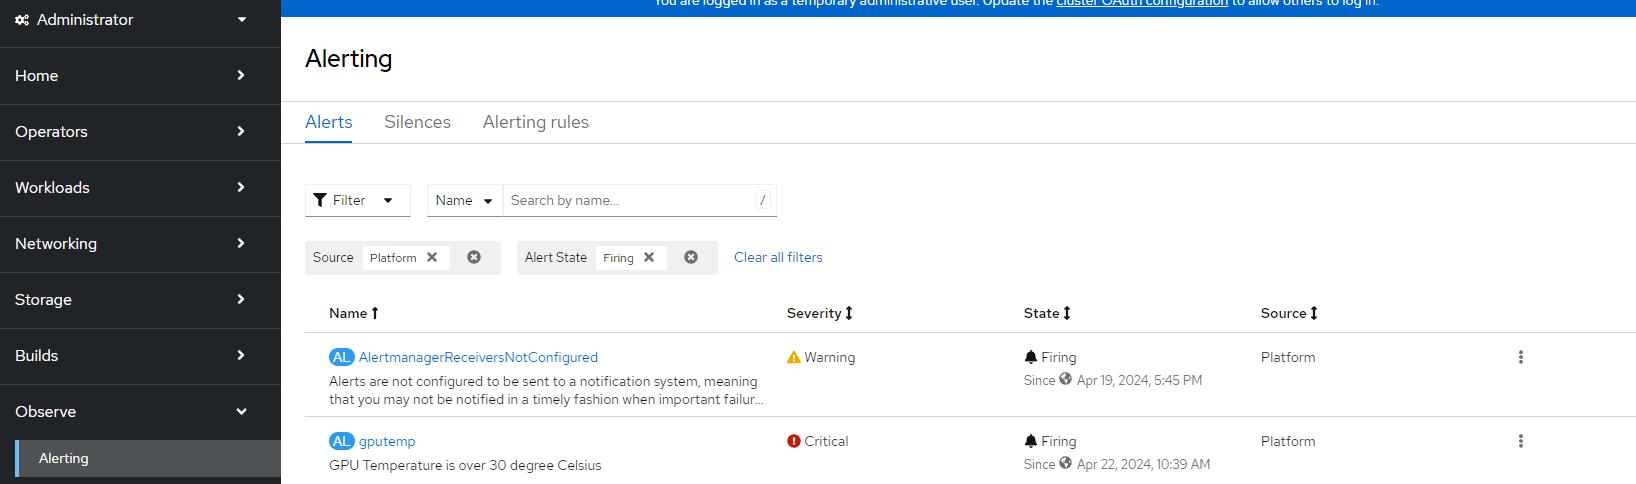
kcalligaLet's apply this
oc apply -f gpu_alertmanager.yamlWithin a few minutes, this alert should show up in the Openshift Console under Observe --> Alerting as shown below.
This can be integrated with the many AlertManager receivers that Openshift supports.
