
Openshift Monitoring, Logging, Observability, and Troubleshooting (Part 1)
Openshift has components related to monitoring, logging, and observability built right into the product. All of these are either ingrained into the web console or can easily be configured through an operator.
Using straight upstream Kubernetes, or many of the other platforms in the marketplace that are built based on Kubernetes, often do not have the built-in integrations (dashboards) and tooling (operators) in place like Openshift does.
These integrations are not simply third-party add-ons that can be installed where you are left alone to work with another vendor to install, operate, and troubleshoot. With Openshift, all of these functions are vetted, tested, and supported as part of the Openshift subscription. This means a lower cost of ownership when compared to our competitors.
In this article, I will show the many ways this information can be visible to your operations team. These visualizations can be used to build nice dashboards and establish troubleshooting and MOP (Method of Procedure) for these operations' teams.
This article will cover the following:
- The visualizations that are built-into the OCP web console.
- Observability Menu in Web Console to include Alerting and Metrics.
- The Network Observability Operator.
- Advanced Cluster Management application and policy visualizations.
- Openshift Logging.
- Openshift Service Mesh.
- Debugging applications using OC-command tooling (cmd-line).
- Debugging node issues using OC-command tooling (cmd-line).
- A follow-on blog post will cover using all of the above to troubleshoot node and application issues.
OCP Web Console
This blog was written using version 4.10.18 of OCP.
As I mentioned previously, the Openshift web console has visualizations already built-in which will allow the operator to see realtime operational data related to the OCP cluster, the nodes that are the foundation of the cluster, and the applications/workloads that run on the cluster.
Let's take the main screen of the web console (Home --> Overview menu)
One of the first boxes shown presents a high-level/color-coded status for some of the main components. The green checked components are healthy but the Insights is showing an issue.
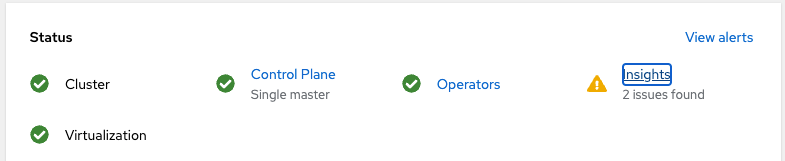
When clicking the Insights link, you are taken to Red Hat's cloud console (console.redhat.com/openshift) which collects telemetry data (only collected if you wish) on the cluster. This telemetry data makes the product better and also helps direct users to troubleshooting articles.
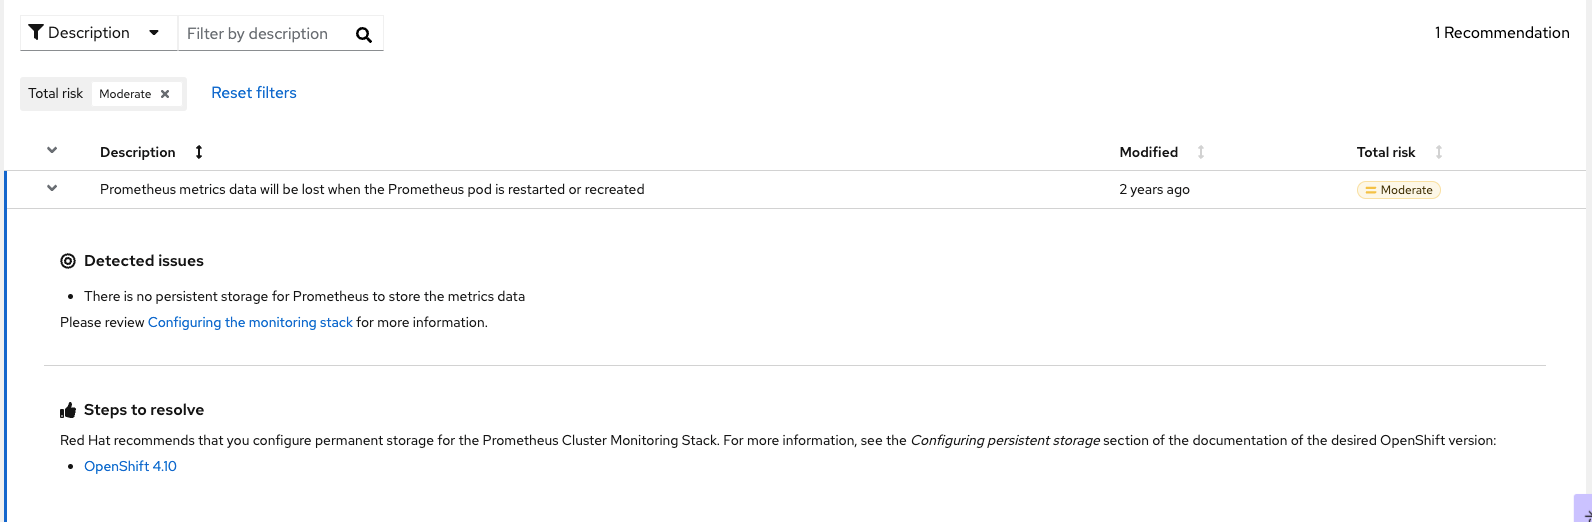
For example, one of the issues encountered on this cluster is due to the fact that Prometheus is storing log data in an EmptyDir volume which won't persist when the pod is restarted or recreated. Here are the steps that show-up in the cloud console to describe this problem in more detail and show troubleshooting steps.
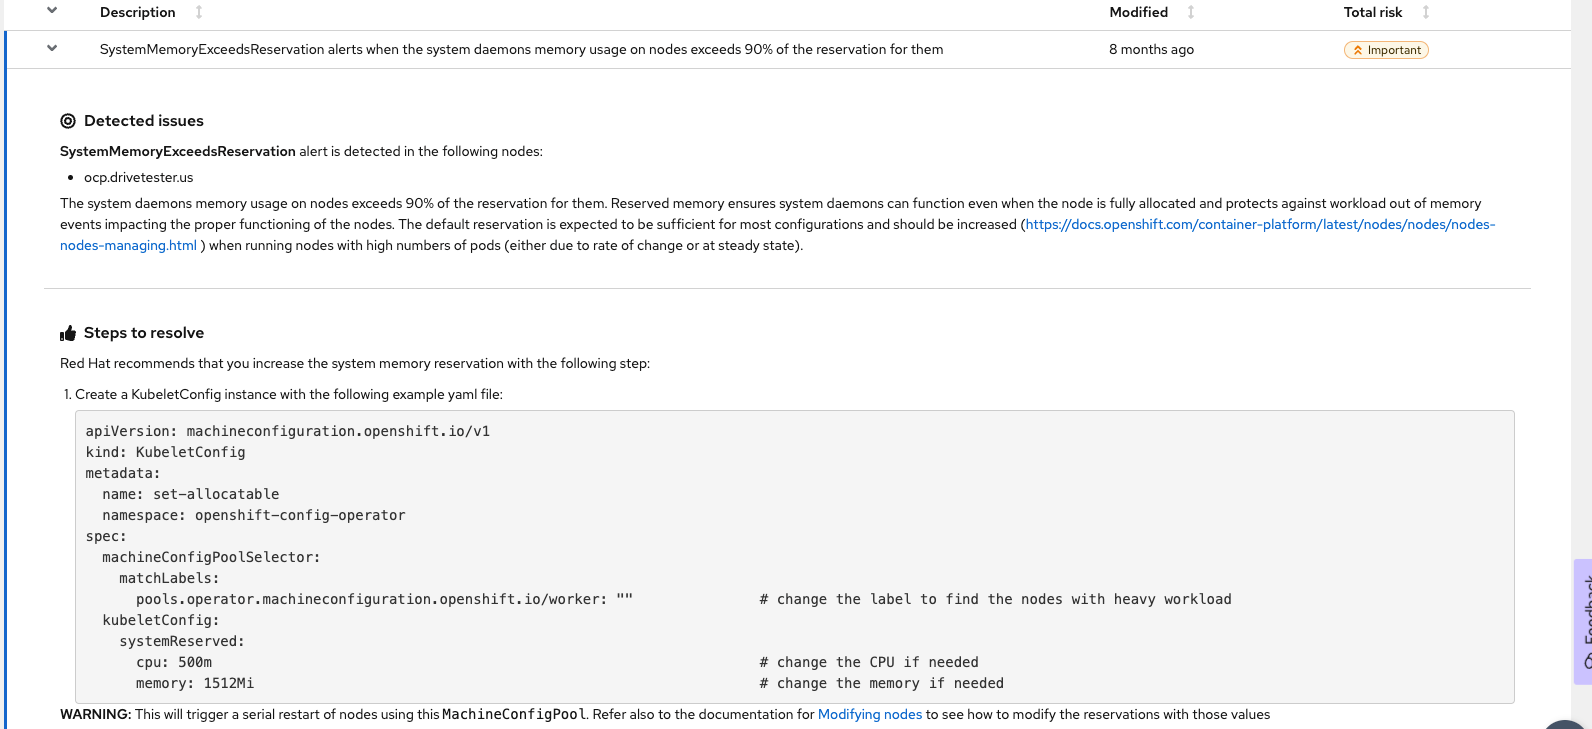
The other issue is due to the fact that my single node cluster is currently oversubscribed on memory. It is just a test cluster so I don't care as much. Notice the clear description of the issue and possible resolution steps.
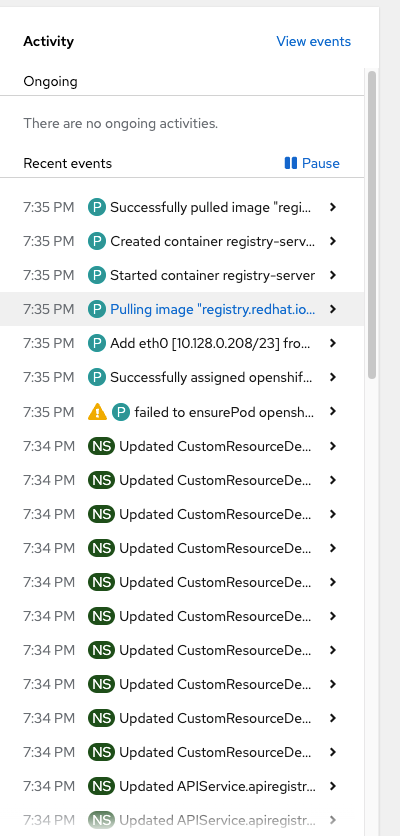
On the right-side of this screen is a list of recent events that are occurred across the whole cluster. This is clickable to drill-down for more information.
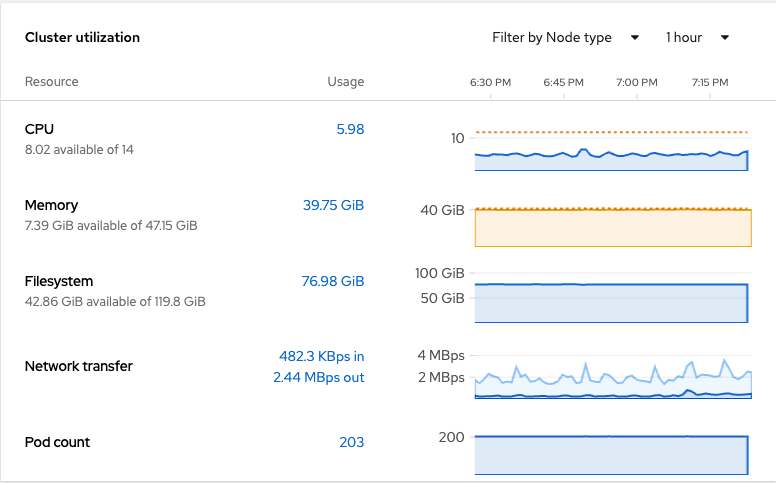
The next box is a screen that shows real-time metrics that were obtained at a cluster-level.
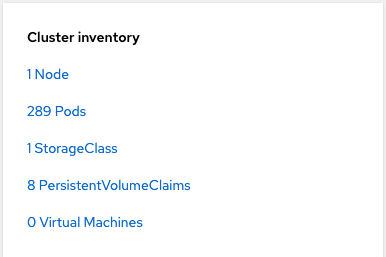
The last box that will be covered in this section is the cluster inventory. This is used to show the total of each common type of object that exists cluster-wide. In some cases, this box is a good place to see if any pods are failing on the cluster.
Observability Menu
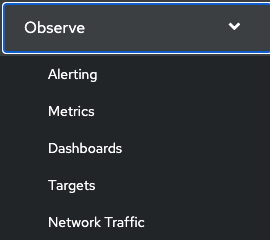
On the left-hand side of the web console is an "Observe" submenu. When this menu is expanded, there are a few sub menus which will be covered briefly.
The "Alerting" menu will take you to a UI (user interface) based on the AlertManager configuration.
The primary tab (Alerts) that is displayed will show any alerts that are currently firing (Source: Platform and Alert State: Firing). This is some of the same information that showed on the main overview screen on the web console.
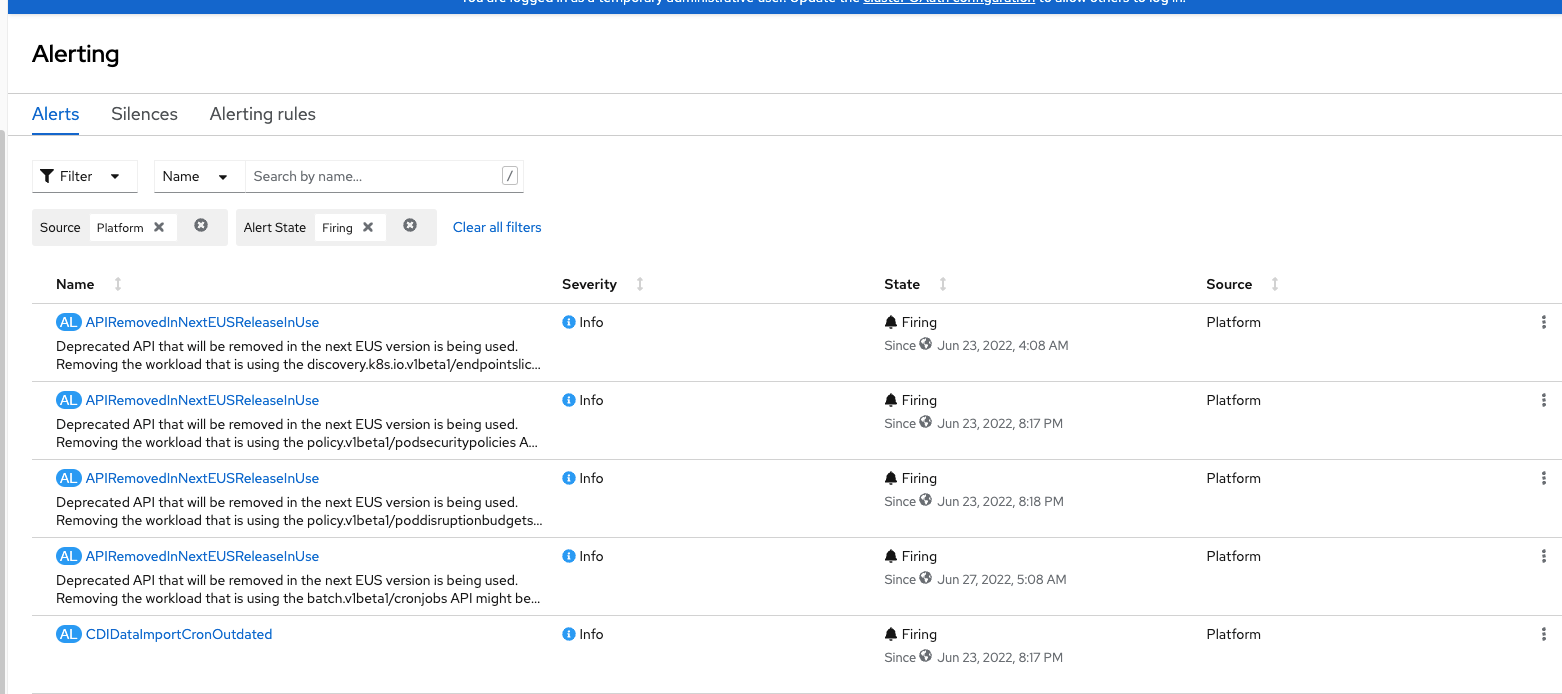
Clicking on the first alert that is firing (APIRemovedInNextEUSReleaseInUse) is just an informational message. Clicking on it provides more details.
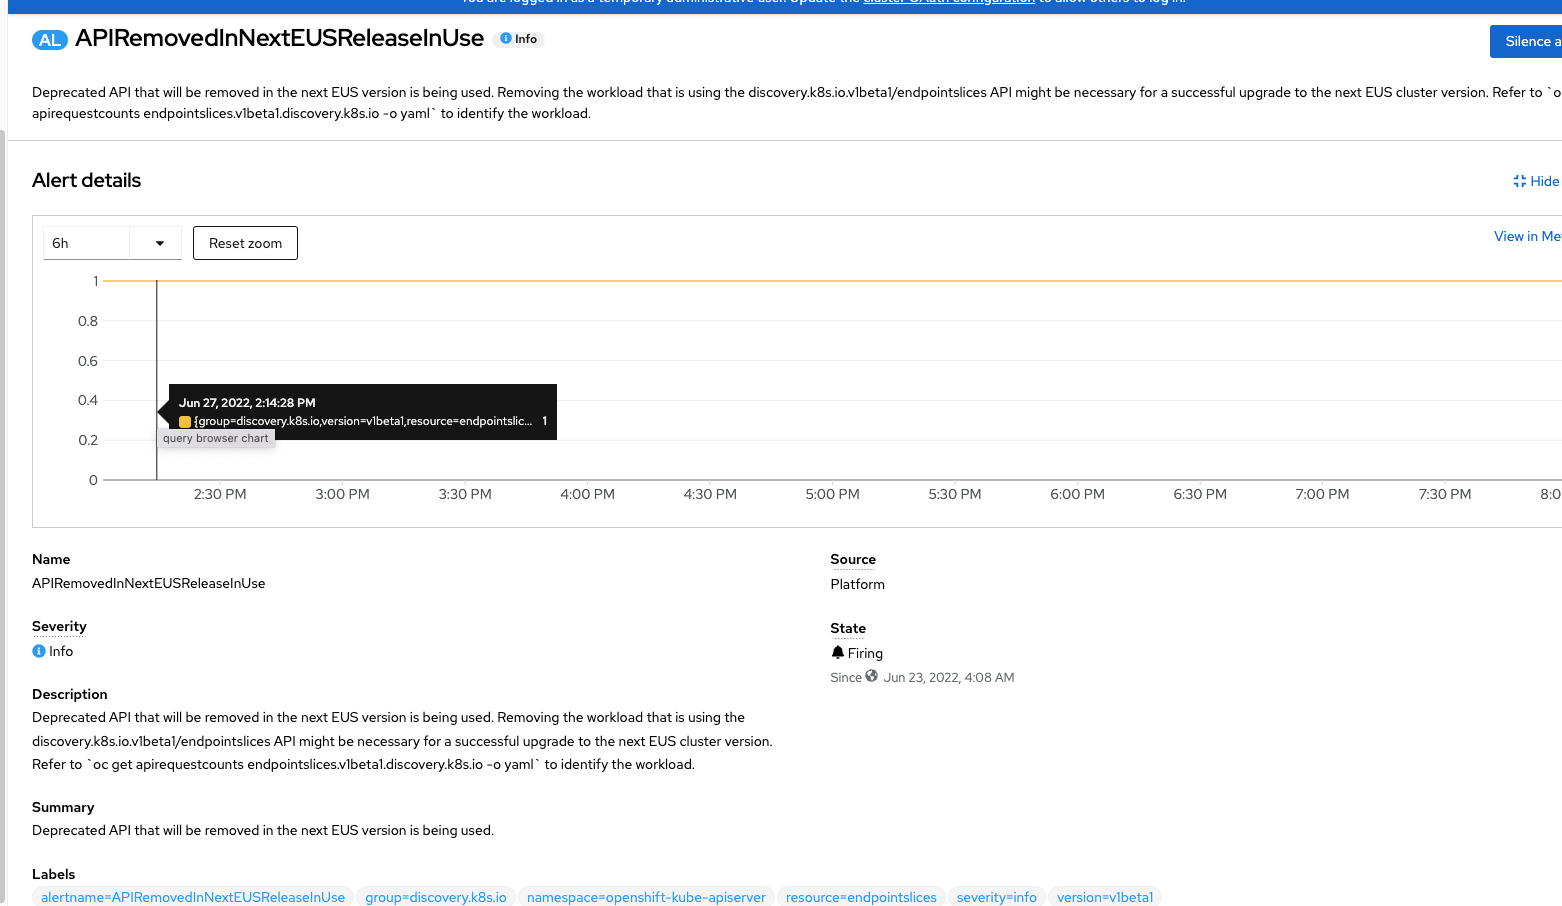
The default 6 hour view show that the alert has been firing (1 meaning true) for at least the last 6 hours. Much more detailed information on this message is also shown in the "Description" and "Summary" sections of the page shown above.
These Alert Manager alerts can trigger many third-party alert mechanisms such as PagerDuty, generic webhook, email, and Slack. The webhook is a good one because it is universal in a lot of ways and is supported by many other alert mechanisms besides the four I listed above. This is all configurable in the Administration --> Cluster Settings --> Configuration menu. Configuration is beyond the scope of this current article but I may do one later as a follow-on.
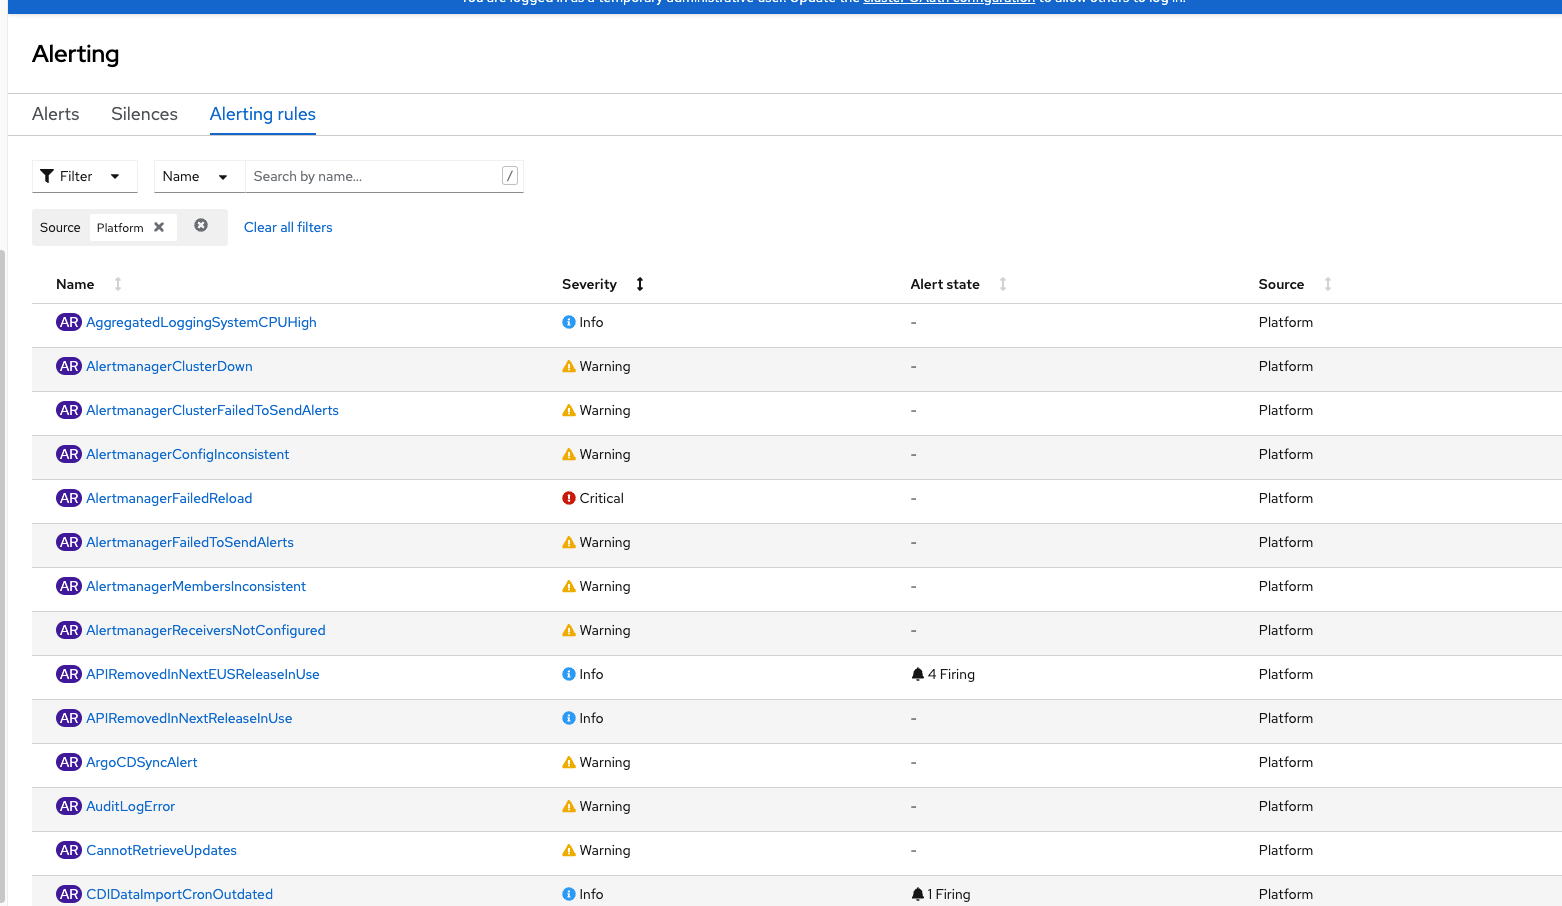
On the "Alerting rules" tab is a list of all the rules that are currently configured as part of OCP. There are many already configured which is another enhancement that OCP brings. You can even add your own custom alerting rules.
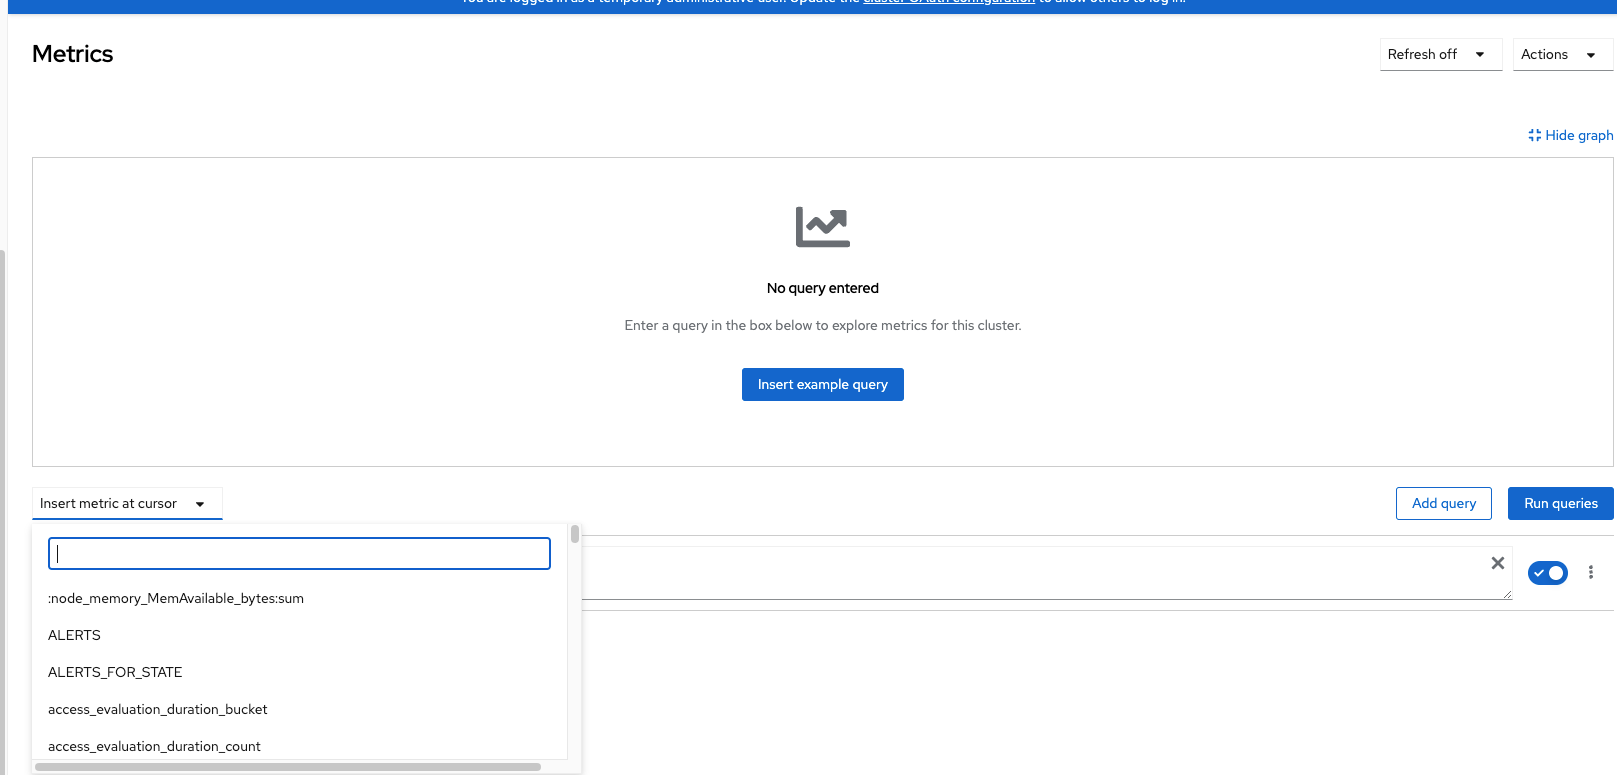
The "Metrics" menu provides a way develop custom queries against Prometheus/metrics to run or there is a long list of queries that are already included which can be used to make more custom dashboards.
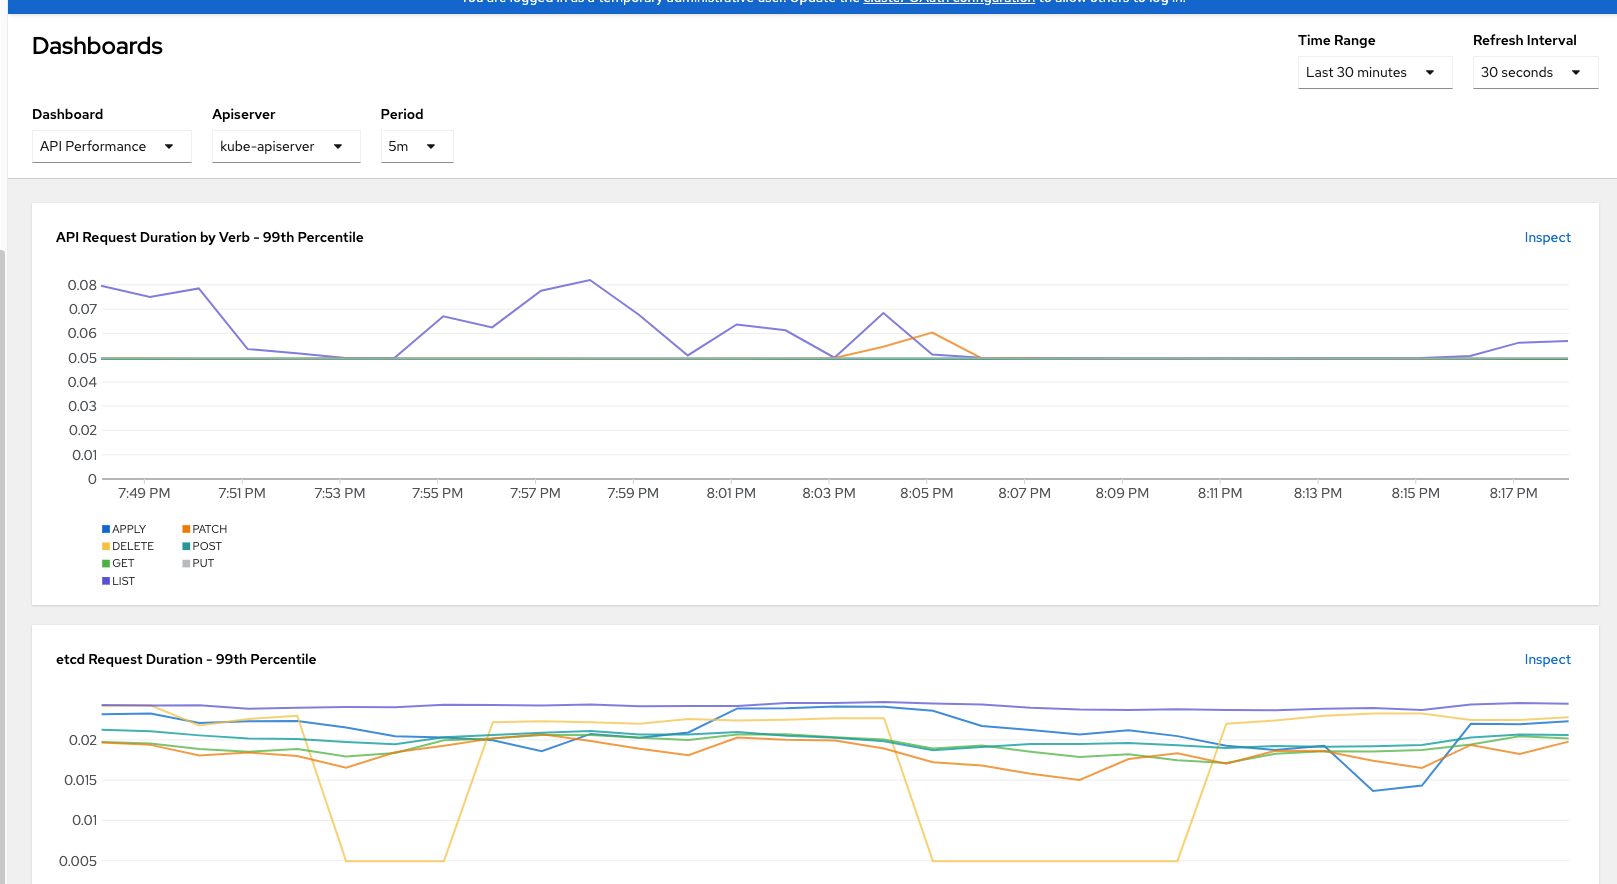
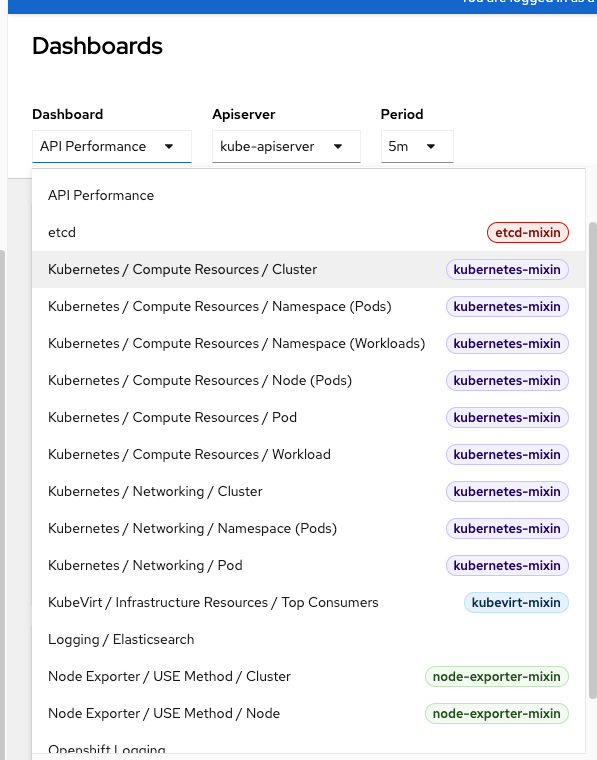
The "Dashboards" menu takes these queries further and provides built-in visualizations that are popular with many OCP administrations/users.
Here is a sample of one of the visualizations on API performance.
Here are some other dashboards that included out-of-the-box with OCP. There are a few more but this was what I could fit in one screenshot.
More information on metrics in regards to using this information to properly size a cluster is on my other blog post.
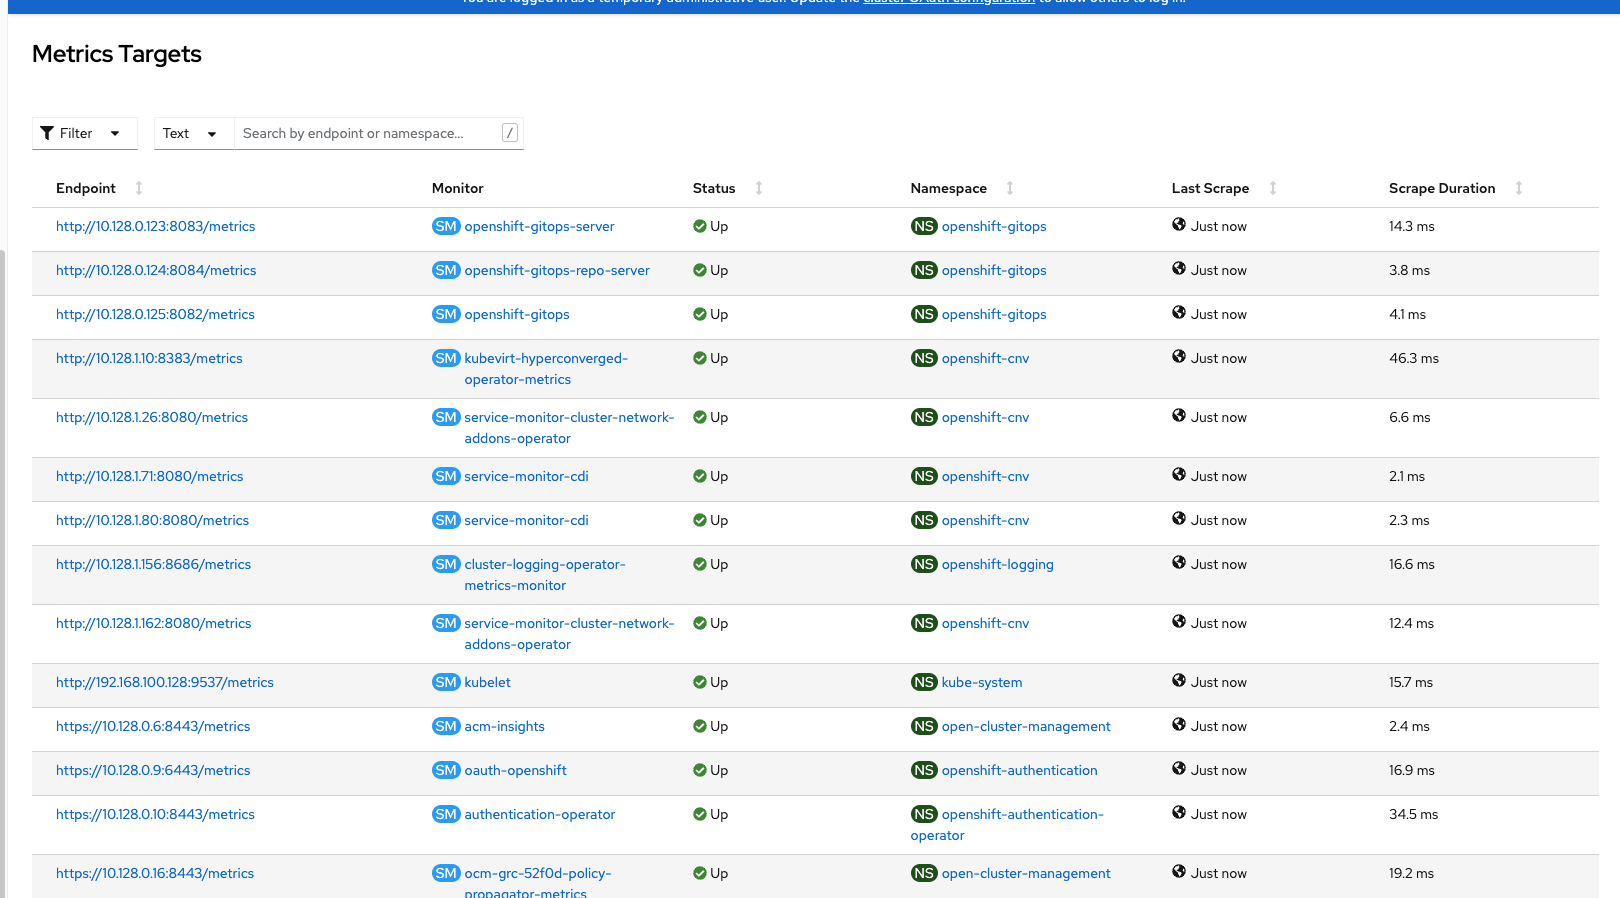
The "Targets" menu shows the status information on all the Prometheus endpoints.
The last menu under "Observe" is related to the Network Observability Operator will will be described in the next section.
Network Observability Operator (NetObserv)
The Network Observability Operator is a "dev preview" feature meaning that it is early release (not supported).
Nonetheless, here is a glimpse of some of the information that is visible with this operator.
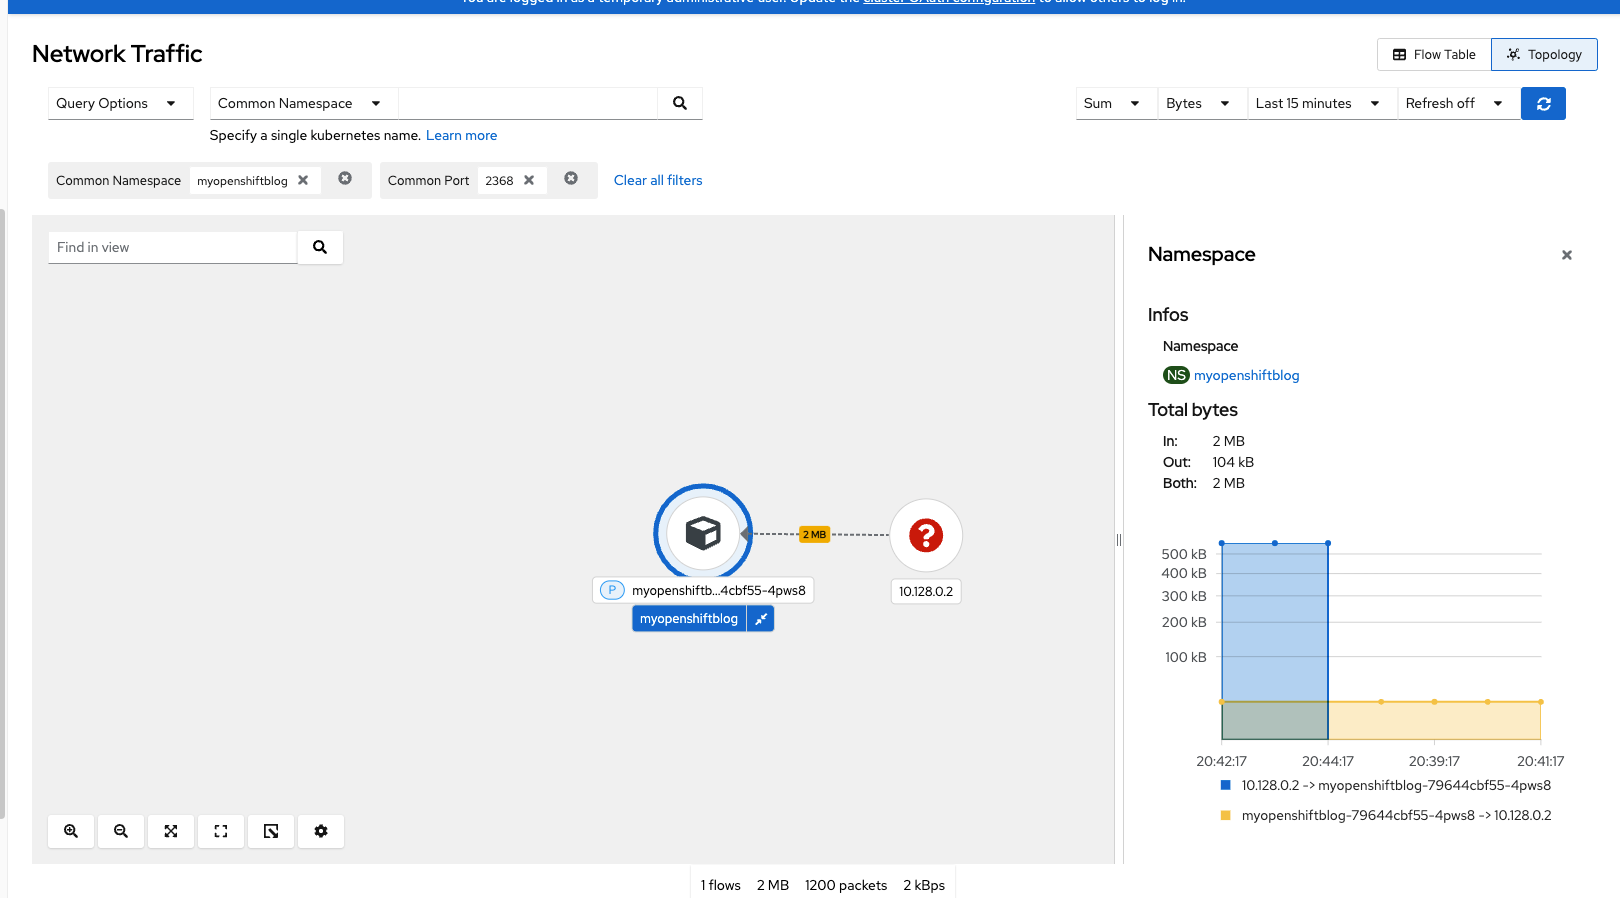
As was mentioned previously, this NetObserv operator adds a submenu to the Openshift web console under the Observe --> Network Traffic menu.
In the screenshot below, I am filtering based on a namespace on my cluster called "myopenshiftblog" which runs a Ghost-based workload.
Let's analyze some of the flows
This screenshot is doing the following filtering:
Common Name: myopenshiftblog
Common Port: 2368
Last 15 Minutes
Flow Table
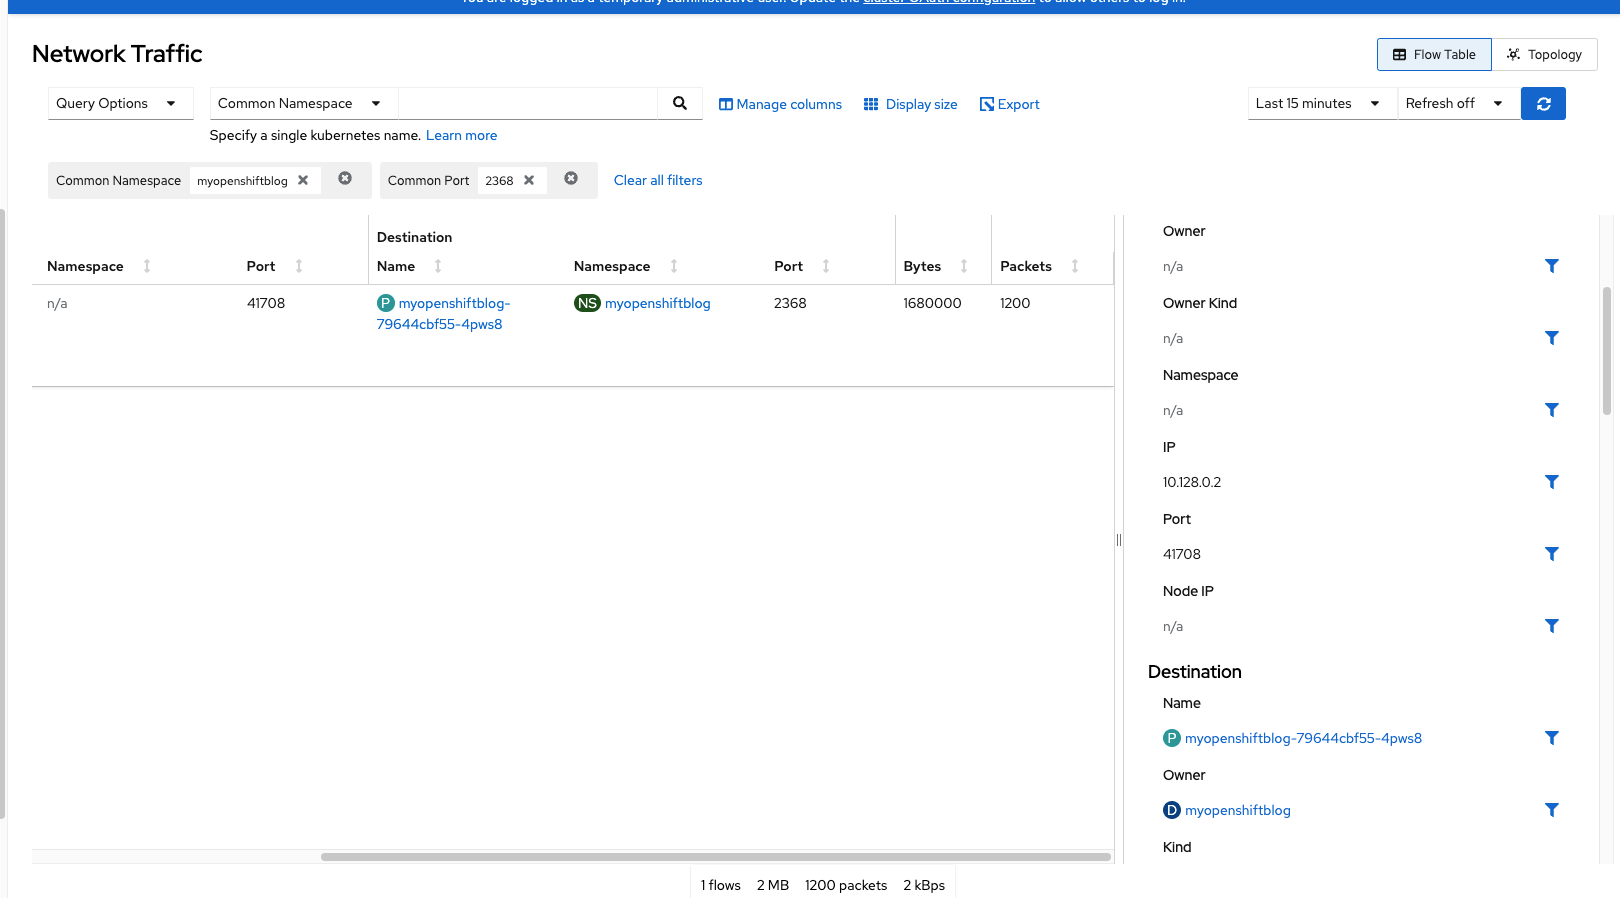
The center of the screen shows some high-level information such as source/destination port, whether it is ingress/egress traffic, the number of bytes and the number of packets tranferred.
The Right-hand side shows the complete JSON of this transaction. With the NetObserv operator, the intra-cluster (same cluster) traffic is only visible at this point (at least based on my cluster). You won't see external IP connections. Only the traffic from the node through the SDN --> Service --> Pod is visible.
The same filtering on topology view show the information in a visual format (IE: graphs).
I may do a follow-on blog on this as the product becomes more mature. Check out the following blogs for more information.
https://cloud.redhat.com/blog/a-guide-to-providing-insight-with-network-observability
Advanced Cluster Management/ACM
Advanced Cluster Management is a one-stop shop for managing application lifecycles and pushing application/governance policies to multiple clusters. At a simplistic level, it is even usable in a lot of ways for working with a single cluster. See my other blog series on ACM for more detail.
For observability purposes, I want to show how this website's (myopenshiftblog.com) workload is visible inside of ACM. It is made up of many components as seen below.
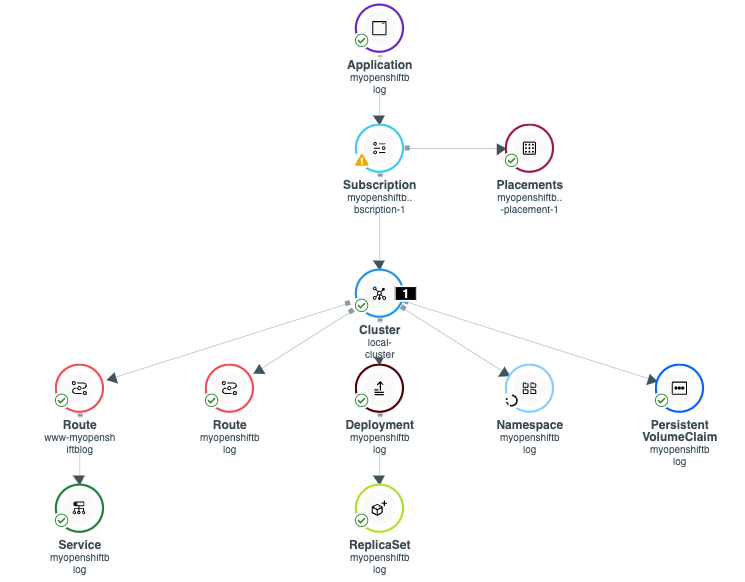
If any one of these components is broken, a yellow icon may show (warning). In my deployment, there is a minor issue with my subscription due to the fact that I created some of the resources (IE: namespace) ahead of time manually and it can't be managed by ACM. In the screenshot above, do you see the circle around namespace and the warning icon on subscription?
Here are more details which can be found by clicking on the subscription object and viewing the raw YAML.

If this application was deployed to multiple clusters, the topology view would show all inter-cluster object associations including good and bad status information. This is just another tool in the toolbox.
Openshift Logging
The Openshift logging operator is really neat. The default install includes indexes for application-type logs and infrastructure (cluster) logs. The web interface is based on Kibana. If using an authentication provider and RBAC (role-based access-controls), the user can only visualize logs within his/her namespace/project.
Fluentd is used as a forwarding mechanism which defaults to the internal ElasticSearch that is built-in to the operator but Fluentd can also be configured to forward to external ElasticSearch instances, Syslog, AWS Cloudwatch, Loki, Kafka, etc.
A high-level view of an infrastructure log and an application log will be shown below.
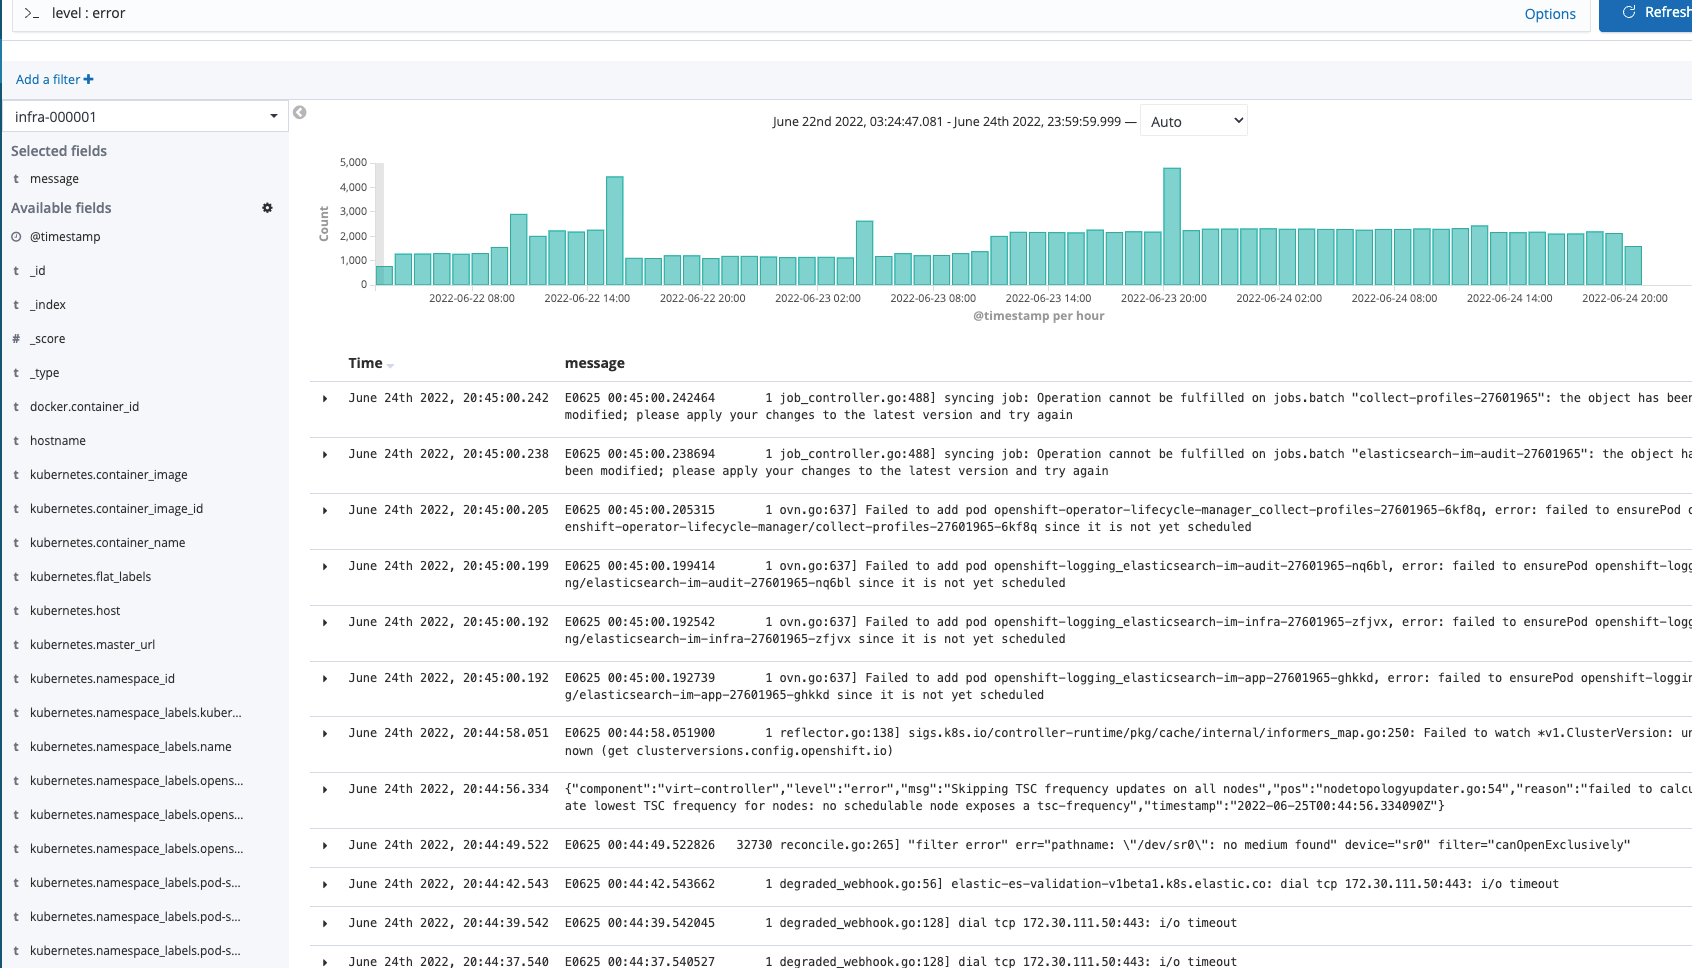
A simple query to run against the infastructure index is "level : error"
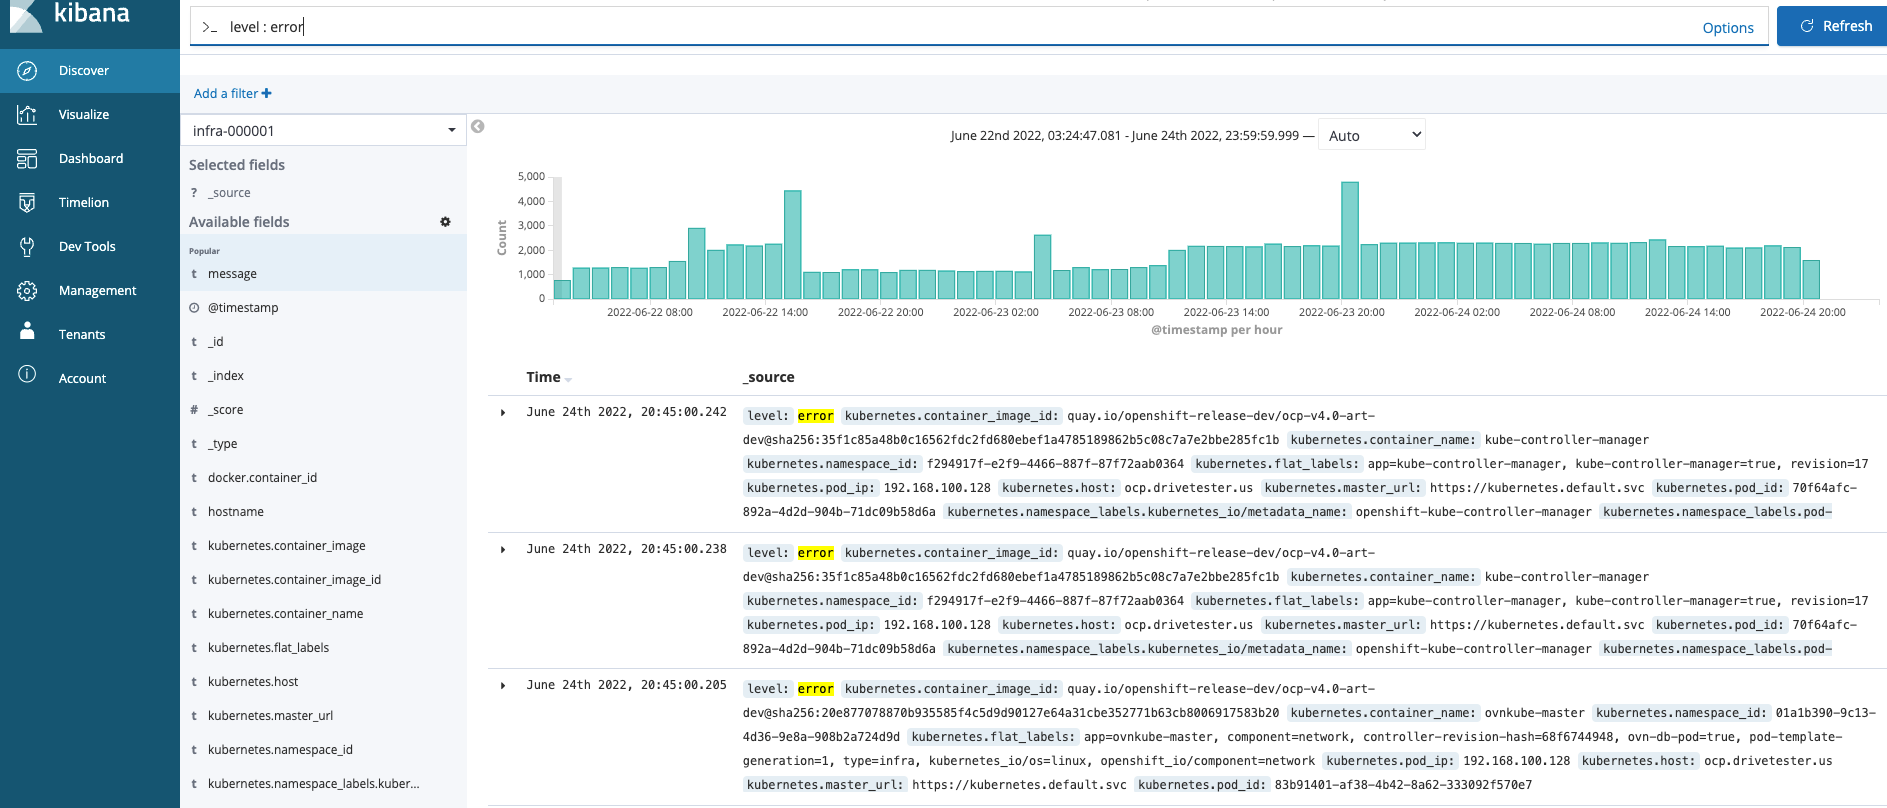
As you can see, many messages show up. Clicking on any of these messages in the center of the screen brings up more details including JSON document and table view as shown below.
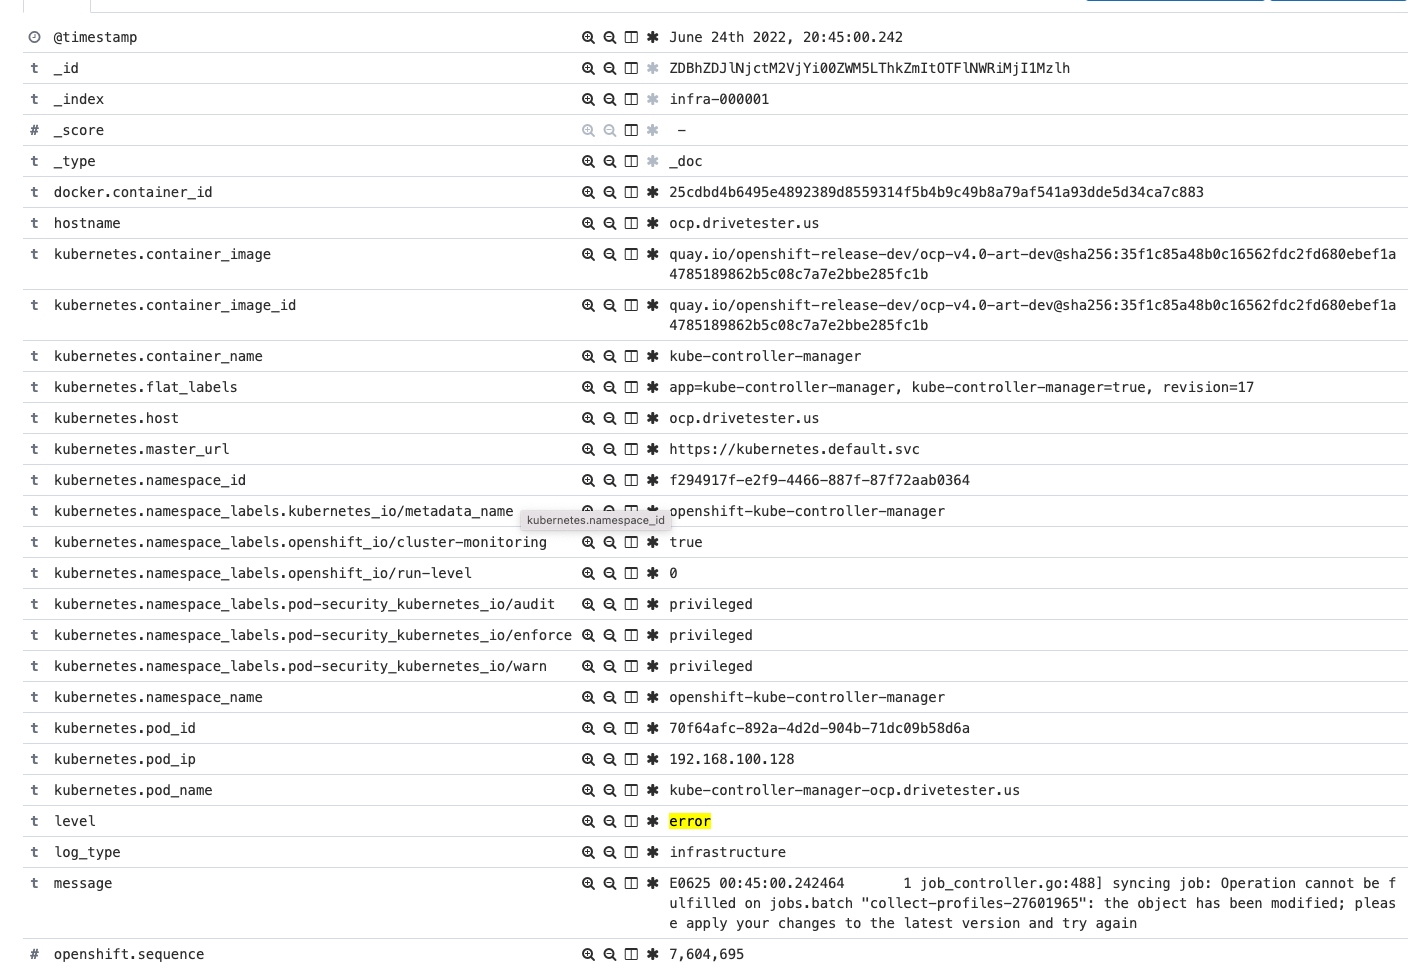
If selecting only the message field, you can see all error messages more easily on the screen.
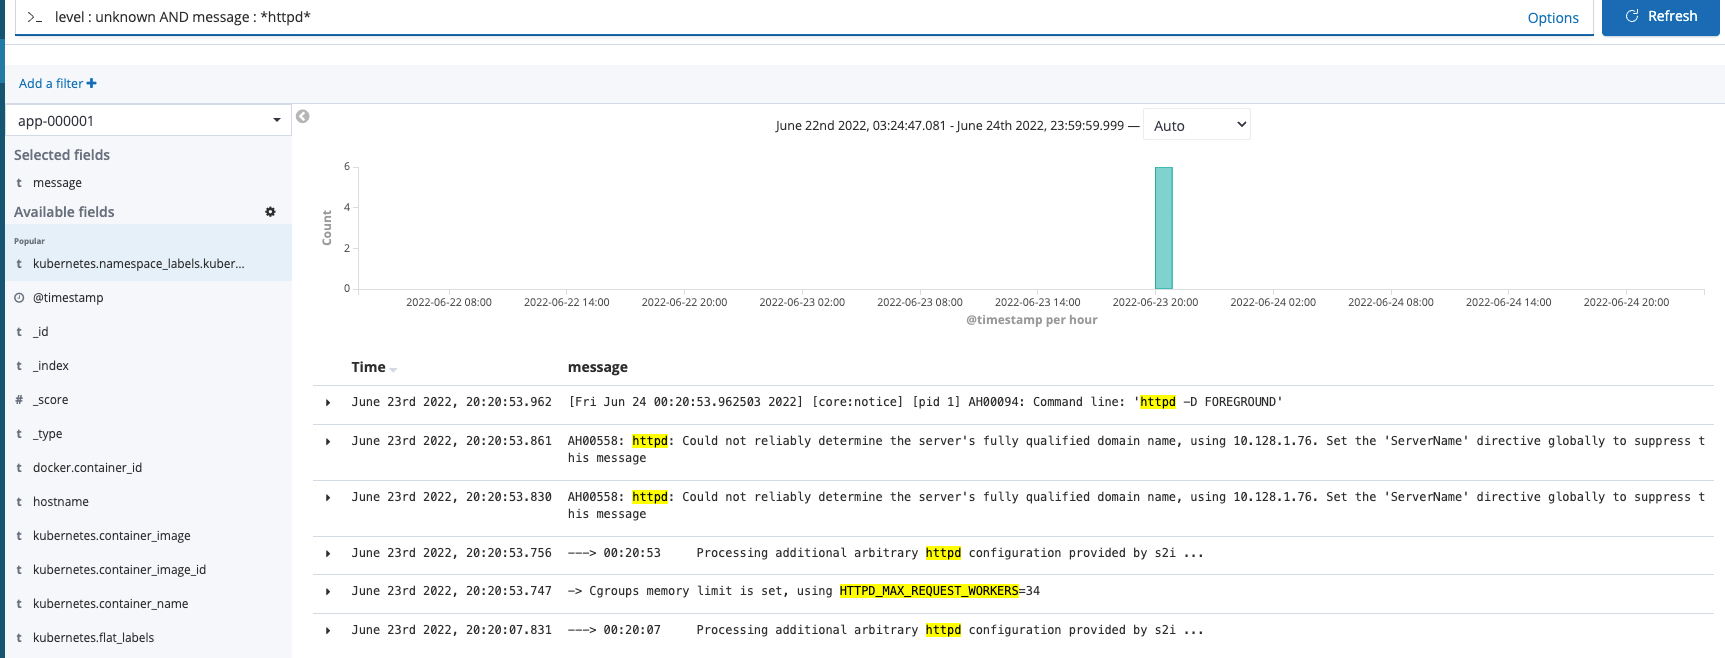
Application level logs can be used in the same manner. These are typically the result of STDOUT from a pod (IE: same as running oc log command) but can be viewed from one location in a more visual manner.
Simply changing to the application index and using the following filter shows some typical messages that show up when running an Apache-based/httpd workload.
Service Mesh
Openshift Service Mesh is based on Istio with a few key differences as shown in the link below.

For this demonstration, a few of my namespaces were added to the service mesh control-plane and an annotation was added to pod definition to inject a side-car container.
The main web interface of Service Mesh is based on Kiali.
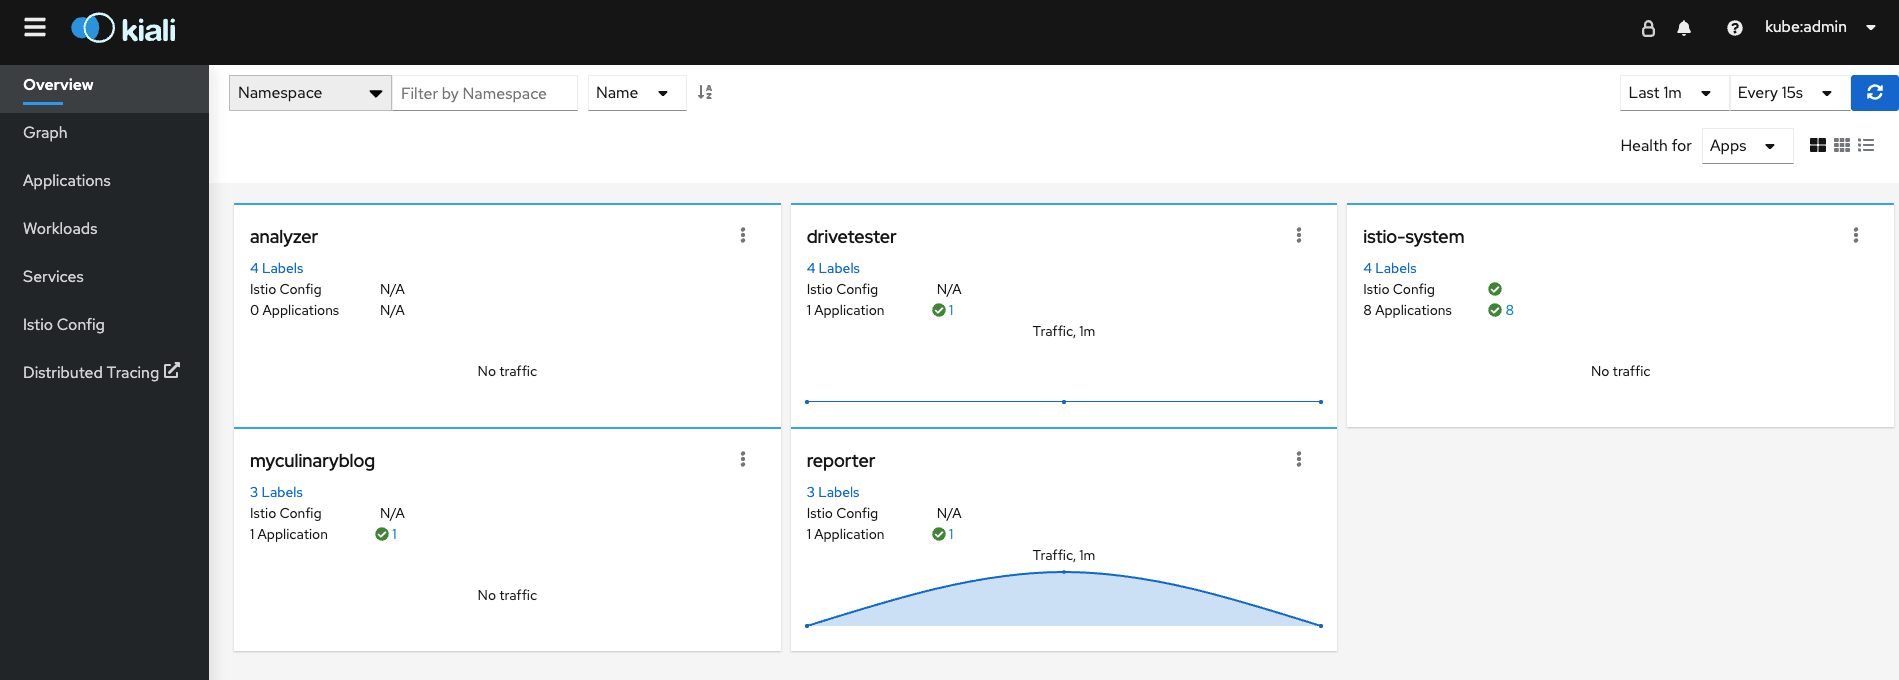
The heaviest namespace on my cluster is related to the reporter namespace is an upload endpoint for my drivetester application. Let's drill-down into this.
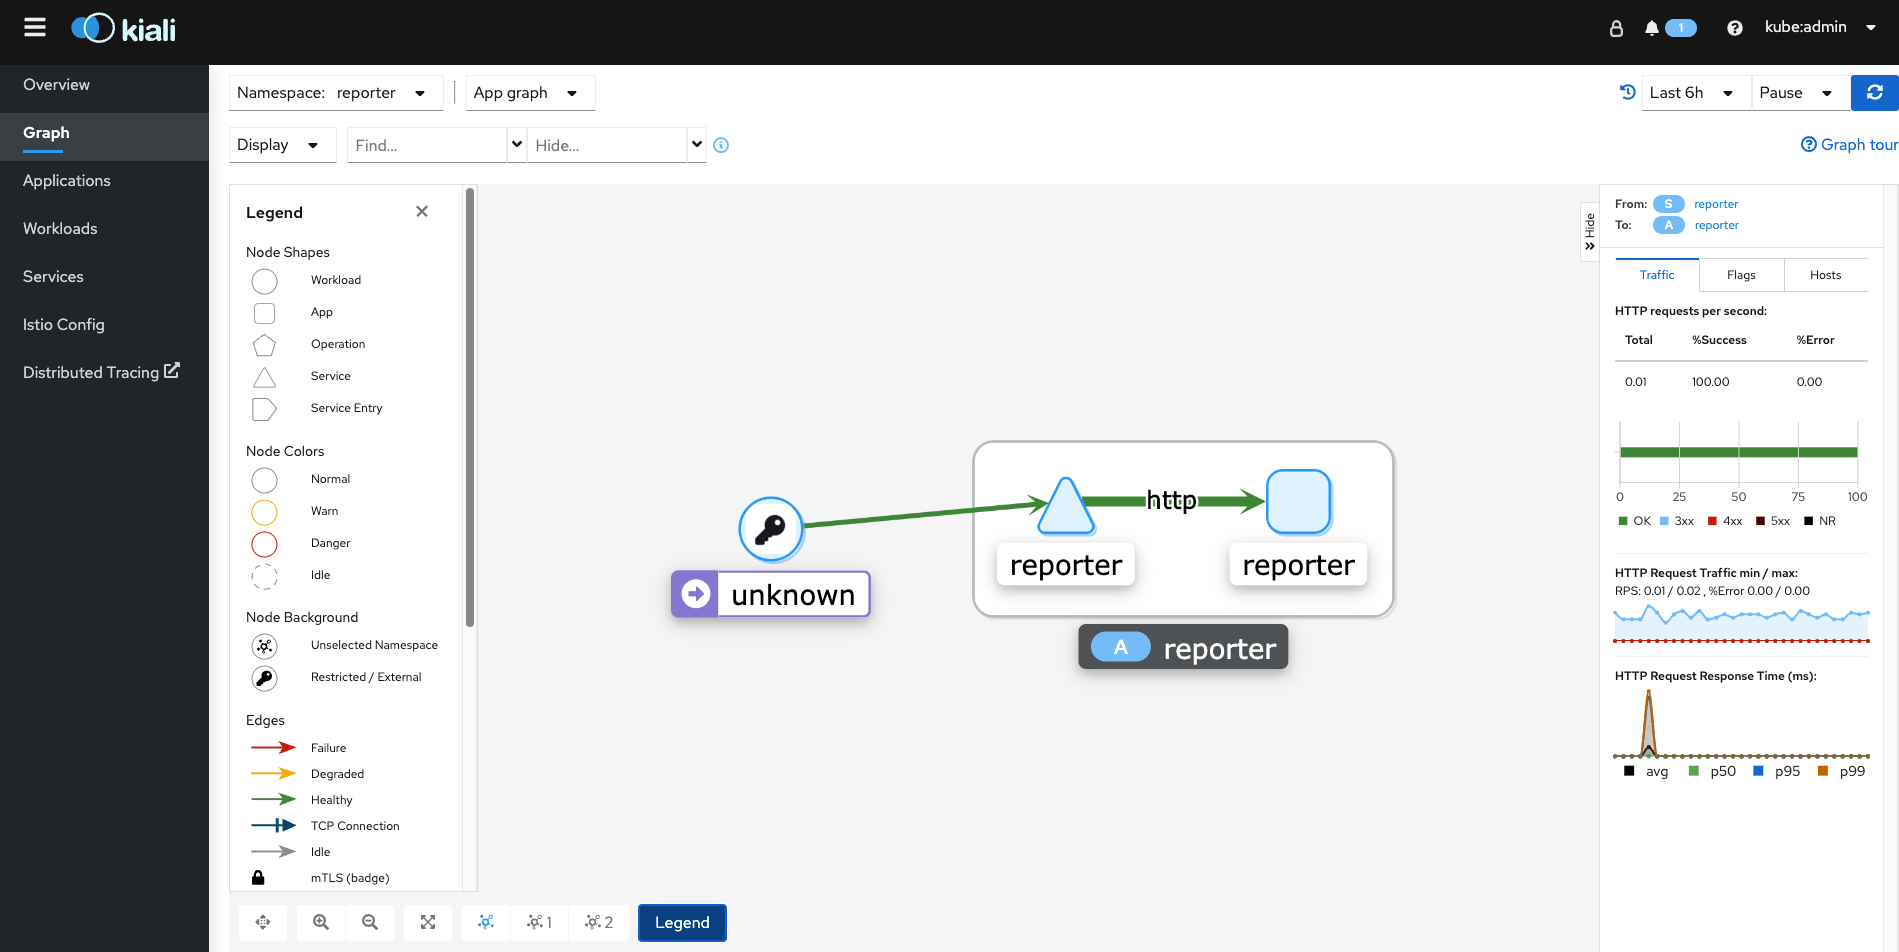
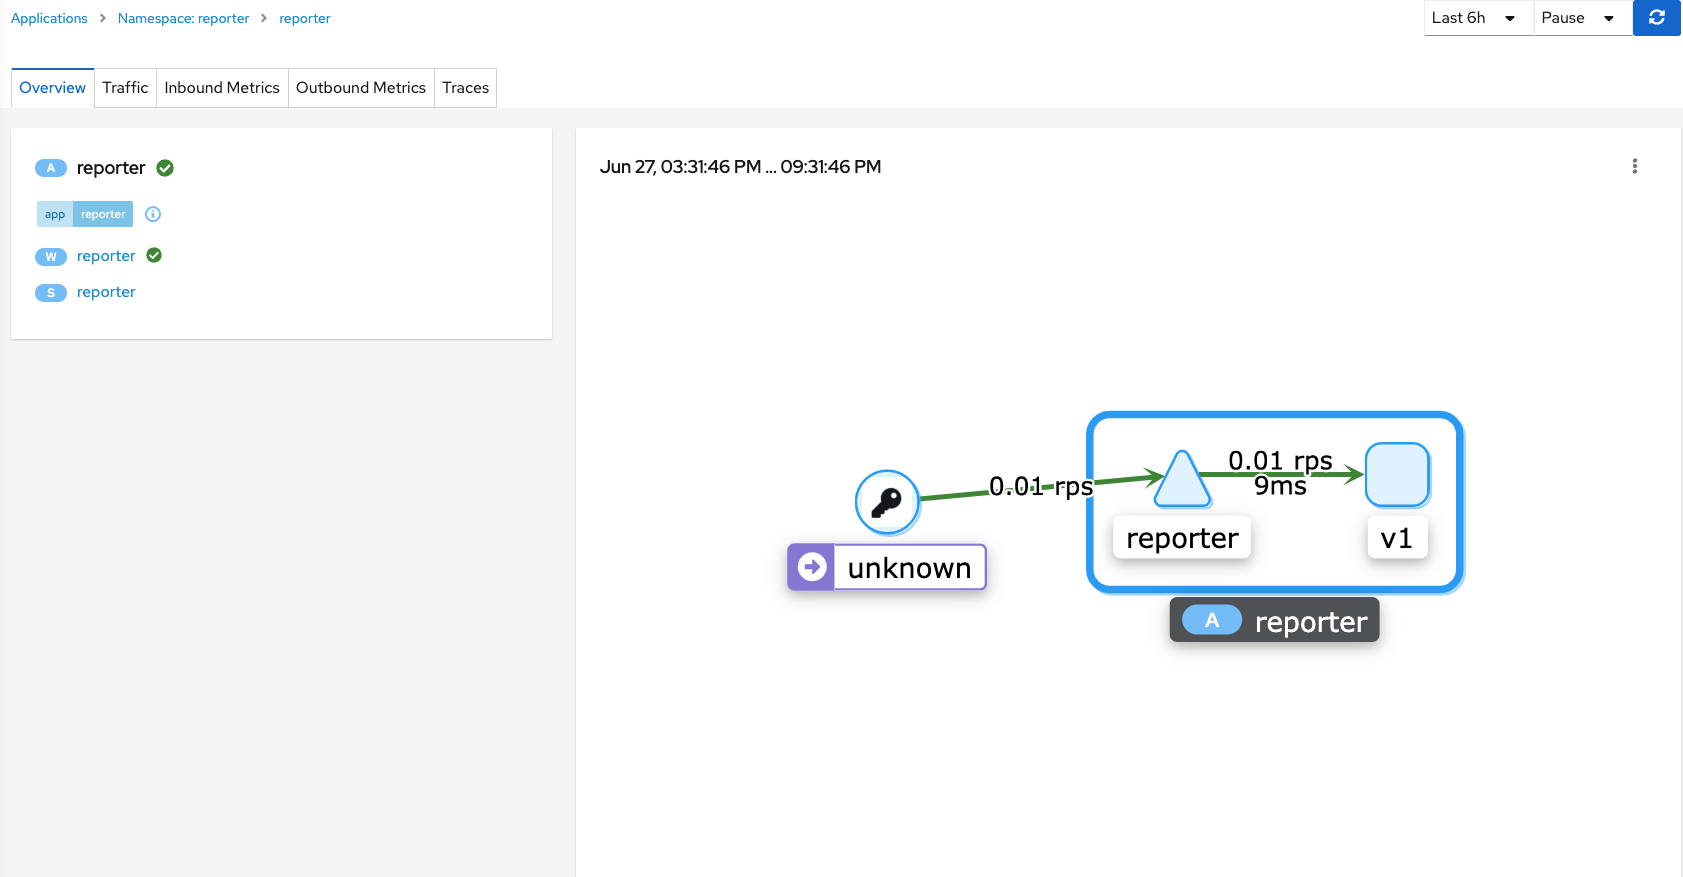
The application graph for reporter namespace (shown above) is telling us the following information:
- On the left-side of the screen, the unknown workload is the entry point for web traffic. It is a restricted/external connection (IE: Internet)
- The external traffic is successfully connecting to the reporter service (IE: green healthy line).
- The reporter service is in turn connecting to the reporter app which is a deployment/pod. The connection from the service to the deployment/pod ius also health (IE: green).
- By clicking on the flow from the service to the deployment/pod which is http-based, bring up another box on the right-side of the screen. Let's drill into this some more.
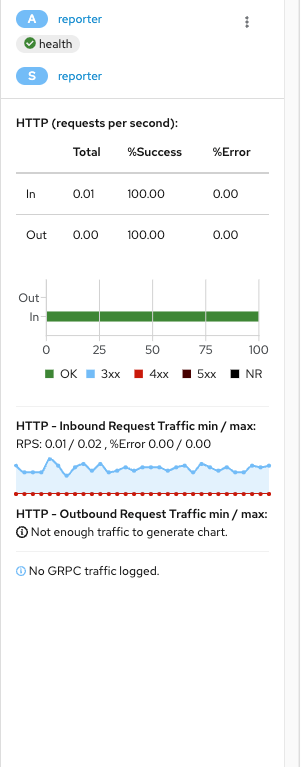
This tells us that there are no communications in the last 6 hours (filter used) that showed any type of 300,400, or 500 application error. There is also some minimal information that appears in regards to requests per second but there isn't enough traffic on this to get any other detail.
Clicking on either the Application or Services submenu let's us drill-down even deeper into each of these areas.
Here is some details that are shown for the Application menu.
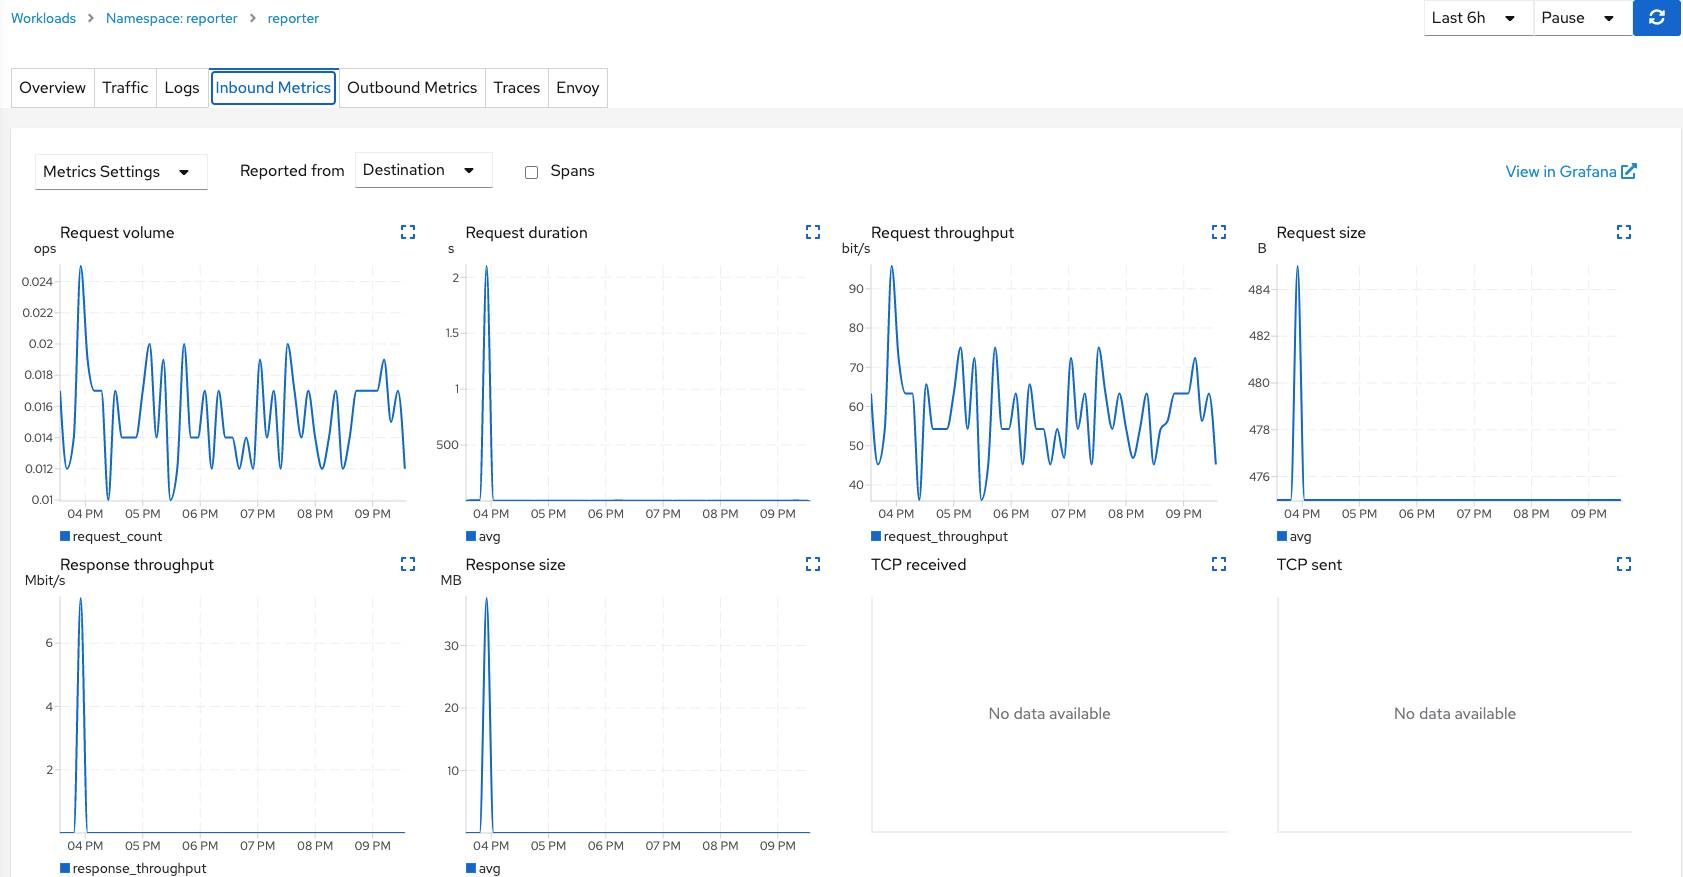
The Application view shows the details in the context of the reporter service connecting to version v1 of the deployment/pod. The v1 is an important concept due to the fact that Service Mesh can also be used to control the way traffic is routed during application upgrades. More on this in another blog post.
More details on viewable in the Traffic, Metrics, and Traces tabs.
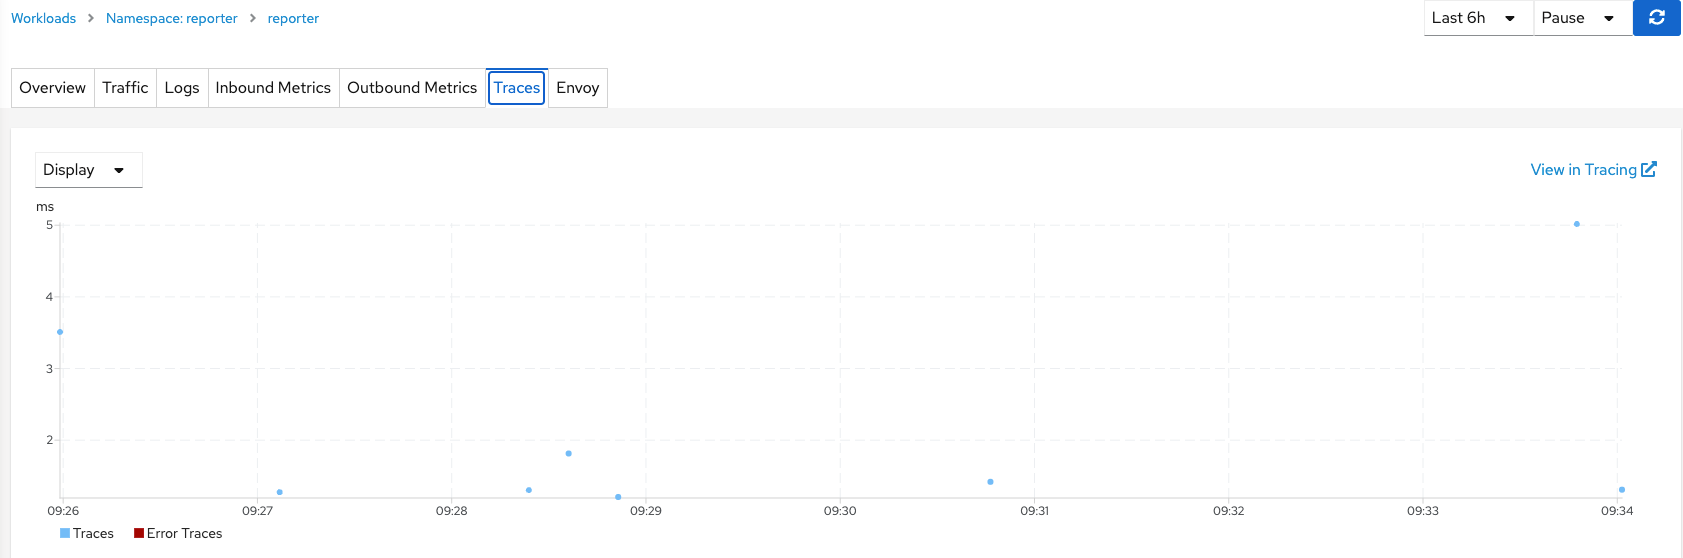
The Traces menu is a good one because it visualizes the response time at certain time-intervals and also highlights times (based on color-coding) when an error condition was encountered (IE: application error or time-out).
Other Openshift Tooling for Debugging/Troubleshooting
The conclusion of this article will show some other views and commands that are useful for debugging and troubleshooting purposes. This is just another way to get a complete view of your OCP environment.
OC ADM TOP
This command can be used used to query metrics to see live utilization information on the cluster on the command-line.
Sub subcommands are as follows:
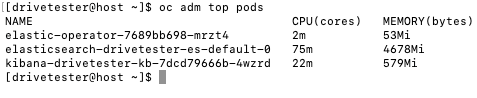
nodes (used to see node utilization)
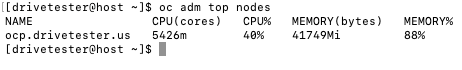
pods (run from within a namespace typically or -A for all namespaces)
OC RSH
To connect to console of pod (similar to logging in through SSH)

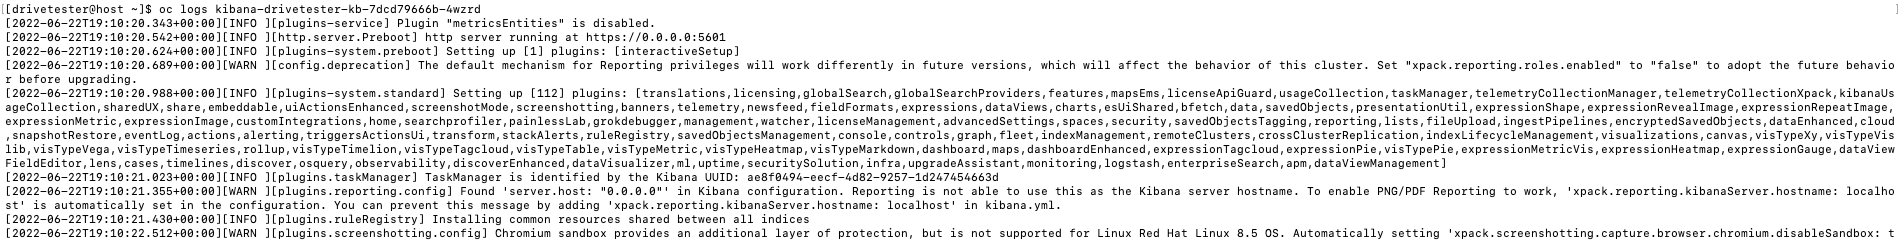
OC LOGS
To see logs (STDOUT) from running pod
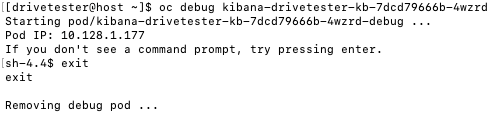
OC DEBUG
This is useful if a workload has an init container or if it never starts fully (IE: liveliness probe fails). This is good if you are aware of the init containers that need to run for this workload to succeed or the specific of other commands that need to succeed for this pod to start correctly.
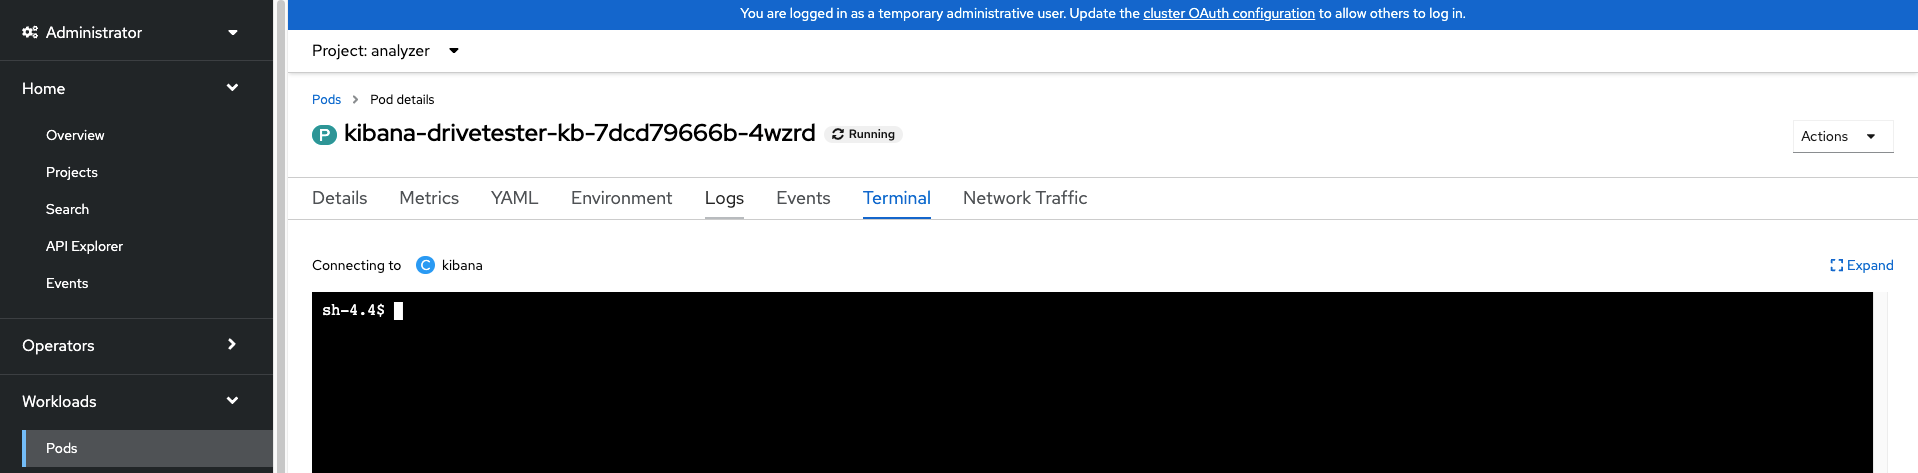
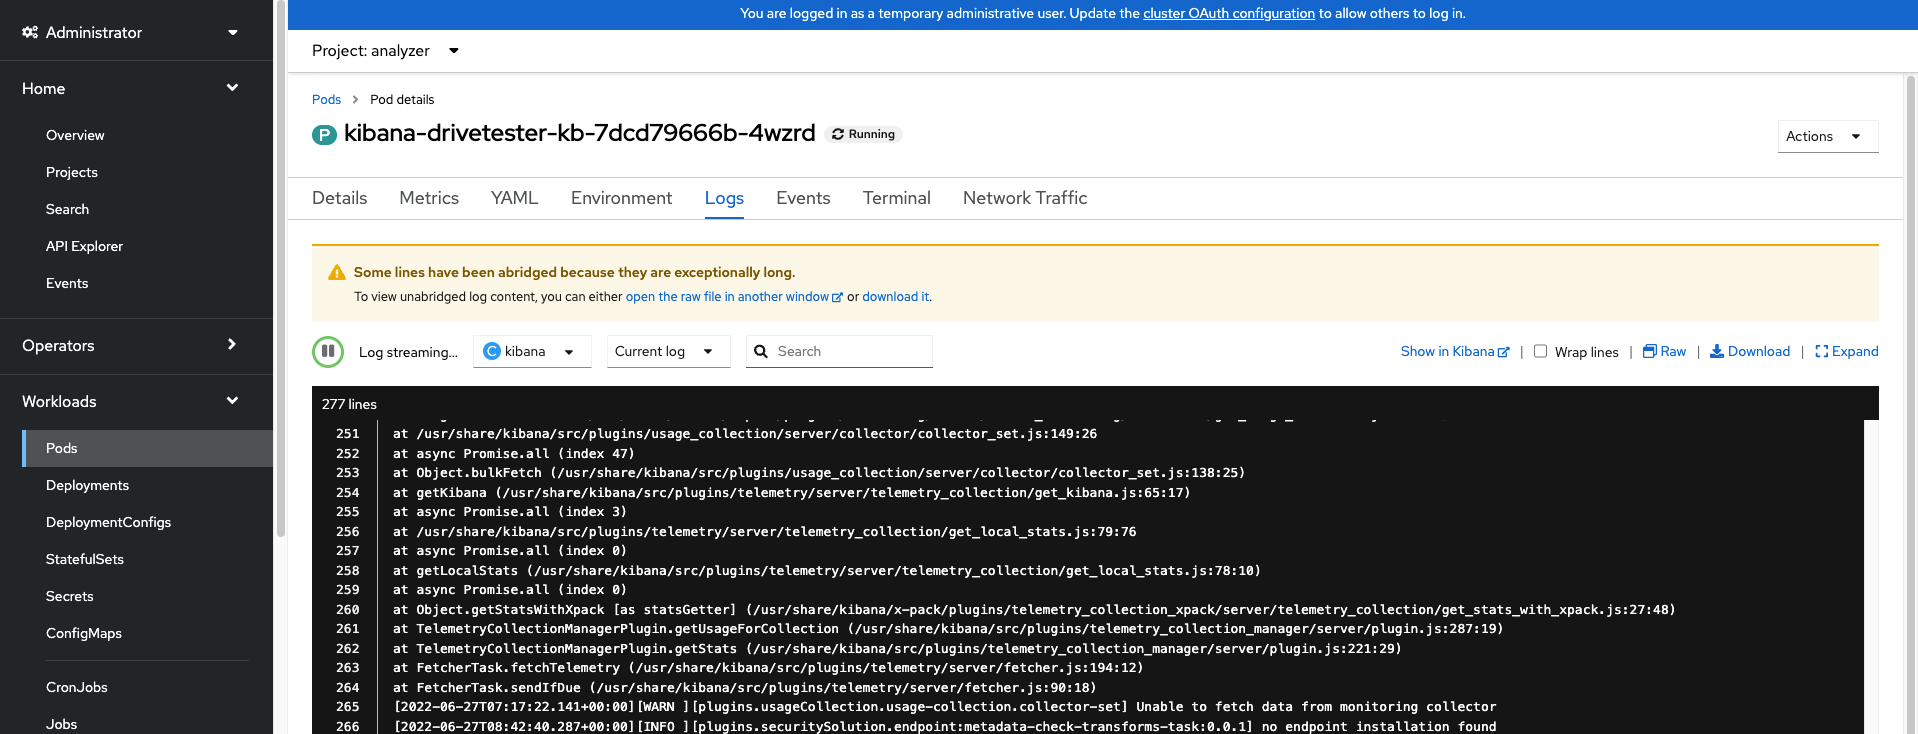
In regards to the three commands listed above (oc rsh/logs/debug), these can all be run from within the Openshift web console. Here is an example of how the terminal/rsh and logs can be viewed from the console.
Workloads --> Pods --> Pod Details --> Terminal
Workloads --> Pods --> Pod Details --> Logs
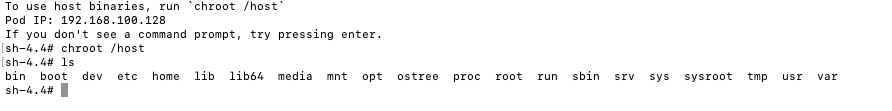
OC DEBUG NODE
This opens up a Shell connection to the node (same as SSHing as core user)
The last two commands are ones that I run fairly often when troubleshooting cluster issues.
OC GET PO (with some options)
oc get po -A|grep -v -e Running -e Completed

The results of this only show the header line meaning that all pods are either in a Running or Completed state. There are no errored pods.
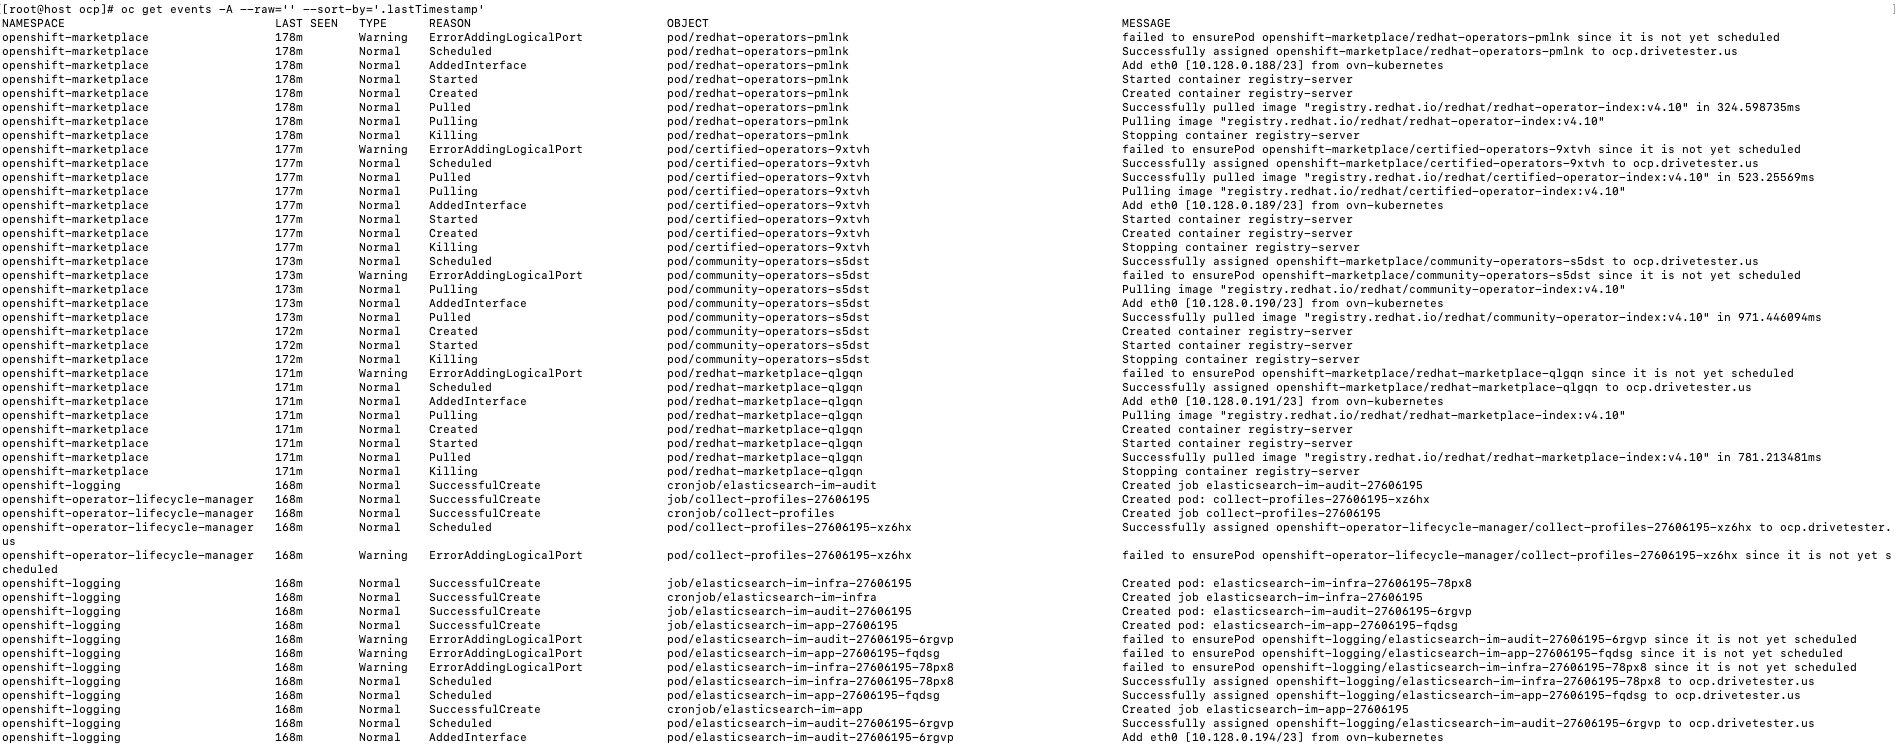
OC GET EVENTS (with some options)
oc get events -A --raw='' --sort-by='.lastTimestamp'
This shows events across the whole cluster in descending time order
I realize this was a lot of material. Part 2 of this blog will be coming shortly which will show ways to troubleshoot a workload and a node using all of these tools.